Footprint charts provide detailed insight into buy and sell orders at specific price levels by displaying actual traded volume within each price bar, enabling traders to identify market sentiment and order flow dynamics. Volume Profile visualizes the distribution of traded volume across price levels over a specified period, highlighting key support and resistance zones through volume accumulation. Explore how combining Footprint charts and Volume Profile can enhance trading strategies and market analysis.
Why it is important
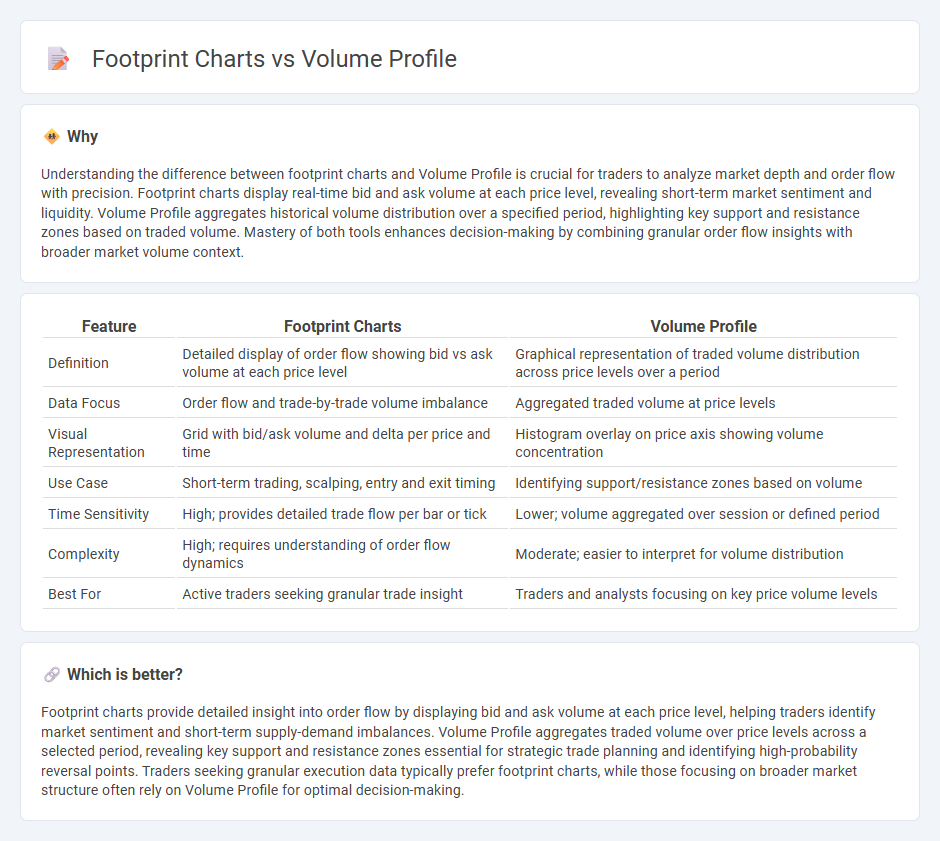
Understanding the difference between footprint charts and Volume Profile is crucial for traders to analyze market depth and order flow with precision. Footprint charts display real-time bid and ask volume at each price level, revealing short-term market sentiment and liquidity. Volume Profile aggregates historical volume distribution over a specified period, highlighting key support and resistance zones based on traded volume. Mastery of both tools enhances decision-making by combining granular order flow insights with broader market volume context.
Comparison Table
| Feature | Footprint Charts | Volume Profile |
|---|---|---|
| Definition | Detailed display of order flow showing bid vs ask volume at each price level | Graphical representation of traded volume distribution across price levels over a period |
| Data Focus | Order flow and trade-by-trade volume imbalance | Aggregated traded volume at price levels |
| Visual Representation | Grid with bid/ask volume and delta per price and time | Histogram overlay on price axis showing volume concentration |
| Use Case | Short-term trading, scalping, entry and exit timing | Identifying support/resistance zones based on volume |
| Time Sensitivity | High; provides detailed trade flow per bar or tick | Lower; volume aggregated over session or defined period |
| Complexity | High; requires understanding of order flow dynamics | Moderate; easier to interpret for volume distribution |
| Best For | Active traders seeking granular trade insight | Traders and analysts focusing on key price volume levels |
Which is better?
Footprint charts provide detailed insight into order flow by displaying bid and ask volume at each price level, helping traders identify market sentiment and short-term supply-demand imbalances. Volume Profile aggregates traded volume over price levels across a selected period, revealing key support and resistance zones essential for strategic trade planning and identifying high-probability reversal points. Traders seeking granular execution data typically prefer footprint charts, while those focusing on broader market structure often rely on Volume Profile for optimal decision-making.
Connection
Footprint charts provide detailed transaction data at each price level, highlighting buyer and seller activity, while Volume Profile aggregates this information to visualize volume distribution over time and price ranges. Both tools use order flow analysis to identify significant support and resistance zones, enhancing trade entries and exits. Integrating footprint charts with Volume Profile offers traders precise market context by combining granular trade prints with broader volume concentration patterns.
Key Terms
Volume Nodes
Volume Profile highlights key volume nodes where trading activity concentrates, revealing support and resistance levels critical for market analysis. Footprint charts provide granular insight into bid and ask volume at each price, but Volume Nodes from the Volume Profile identify areas with the highest traded volumes over time. Explore how traders leverage Volume Nodes within Volume Profile to enhance trade decisions and market context.
Bid-Ask Imbalance
Volume Profile charts aggregate traded volume at specific price levels to highlight key support and resistance zones, while footprint charts provide a granular view of market activity by displaying individual bid and ask volumes within each price bar. Focusing on bid-ask imbalance, footprint charts reveal the precise supply and demand dynamics by illustrating aggressive buying and selling pressure, enabling traders to identify potential reversals or continuation patterns with greater accuracy. Explore how integrating bid-ask imbalance analysis in footprint charts can improve your trading strategy.
Point of Control (POC)
Volume Profile charts highlight the Point of Control (POC) as the price level with the highest traded volume, providing traders a key reference for support and resistance zones. Footprint charts offer a granular view of the POC by displaying real-time order flow and volume distribution at each price level, enhancing precision in market analysis. Explore deeper insights into how POC analysis on both chart types can improve trading strategies.
Source and External Links
Advanced Day Trading Strategies Using Volume Profile - TradingSim - Volume Profile is a volume-by-price indicator that shows total trading volume at each price level over a specified period, helping traders visualize significant price levels and improve trading performance through detailed volume activity analysis at different prices.
Understanding Volume Profile: A Powerful Tool for Traders - Volume Profile plots trading volume against price rather than time, enabling traders to identify key price levels with high trading activity which often correspond to important support and resistance zones.
Volume profile indicators: basic concepts - TradingView - Volume Profile is an advanced charting tool that displays trading activity as a histogram by price levels over a specified period, dividing volume into up and down trades, with several types available such as fixed range and visible range profiles to suit different analytical needs.