Order book imbalance reflects the difference between buy and sell orders at specific price levels, indicating market pressure and potential price movements. Time and Sales data records real-time transaction details, including price, volume, and time, offering precise insight into market activity and trader behavior. Explore these tools to deepen your understanding of market dynamics and optimize trading strategies.
Why it is important
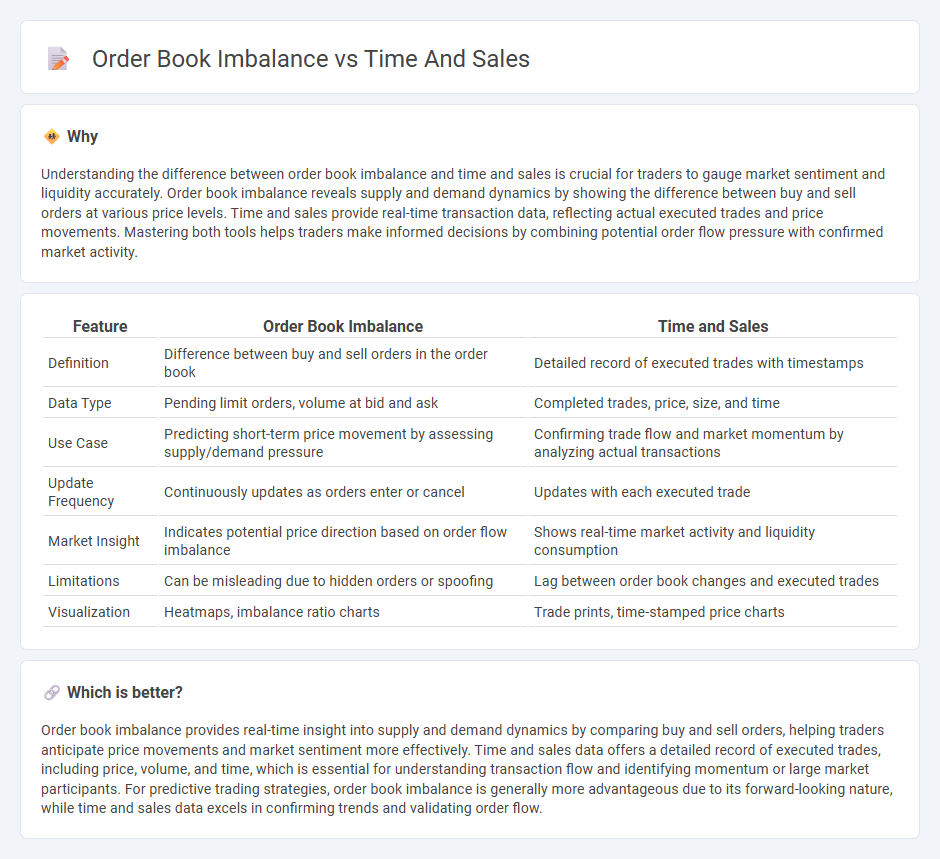
Understanding the difference between order book imbalance and time and sales is crucial for traders to gauge market sentiment and liquidity accurately. Order book imbalance reveals supply and demand dynamics by showing the difference between buy and sell orders at various price levels. Time and sales provide real-time transaction data, reflecting actual executed trades and price movements. Mastering both tools helps traders make informed decisions by combining potential order flow pressure with confirmed market activity.
Comparison Table
| Feature | Order Book Imbalance | Time and Sales |
|---|---|---|
| Definition | Difference between buy and sell orders in the order book | Detailed record of executed trades with timestamps |
| Data Type | Pending limit orders, volume at bid and ask | Completed trades, price, size, and time |
| Use Case | Predicting short-term price movement by assessing supply/demand pressure | Confirming trade flow and market momentum by analyzing actual transactions |
| Update Frequency | Continuously updates as orders enter or cancel | Updates with each executed trade |
| Market Insight | Indicates potential price direction based on order flow imbalance | Shows real-time market activity and liquidity consumption |
| Limitations | Can be misleading due to hidden orders or spoofing | Lag between order book changes and executed trades |
| Visualization | Heatmaps, imbalance ratio charts | Trade prints, time-stamped price charts |
Which is better?
Order book imbalance provides real-time insight into supply and demand dynamics by comparing buy and sell orders, helping traders anticipate price movements and market sentiment more effectively. Time and sales data offers a detailed record of executed trades, including price, volume, and time, which is essential for understanding transaction flow and identifying momentum or large market participants. For predictive trading strategies, order book imbalance is generally more advantageous due to its forward-looking nature, while time and sales data excels in confirming trends and validating order flow.
Connection
Order book imbalance measures the difference between buy and sell orders, reflecting supply and demand dynamics in real-time trading. Time and sales data provide a granular record of executed trades, revealing transaction prices, volumes, and timestamps that confirm how order book imbalances translate into market activity. Together, these tools enable traders to anticipate price movements and liquidity shifts by analyzing order flow and trade execution patterns.
Key Terms
Trade Prints
Time and sales data offers a detailed record of executed trades, including price, size, and timestamp, essential for analyzing market momentum. Order book imbalance highlights the difference between buy and sell order quantities at various price levels, providing insight into potential price direction and market pressure. Explore how combining trade prints with order book imbalance enhances real-time trading decisions and depth of market understanding.
Bid-Ask Volume
Time and sales provide a detailed tape of executed trades showing price, volume, and time, offering insights into market momentum and liquidity shifts. The order book imbalance, particularly analyzing bid-ask volume, reveals real-time supply and demand pressures by highlighting the difference between resting buy and sell orders at various price levels. Explore deeper to understand how integrating bid-ask volume from both time and sales and order book data enhance trading strategies.
Market Depth
Market Depth provides a comprehensive view of liquidity by displaying the order book imbalance, which highlights the concentration of buy and sell orders at various price levels. Time and Sales data, or the tape, reveals executed trades, offering insights into actual market transactions and momentum. Explore how combining Market Depth insights with Time and Sales can enhance trading strategies and decision-making.
Source and External Links
Time and Sales: How to Read the Tape Like a Pro - Warrior Trading - Time and sales is a record of all stock transactions throughout the trading day, showing trade size, price, and time, used by traders to gauge supply and demand shifts in the market.
Time and Sales for Traders - The Complete Guide - Time and sales is a real-time feed of every trade executed for a stock, helping traders gauge activity and identify entry or exit points by analyzing time, price, and volume data.
Time & Sales Overview - TT Help Library - Trading Technologies - The Time & Sales widget displays details for each trade in real-time and historical format, including date, time, price, quantity, and color-coding to indicate buyer or seller aggressiveness.