High-frequency tick charts capture every trade with precision, providing real-time insights into market momentum and liquidity, crucial for traders aiming to exploit small price movements rapidly. Range bar charts focus on price movement within predefined ranges, filtering out time to highlight volatility and trend strength, making them valuable for identifying clearer entry and exit points. Explore how combining these chart types can enhance your trading strategy and improve market analysis.
Why it is important
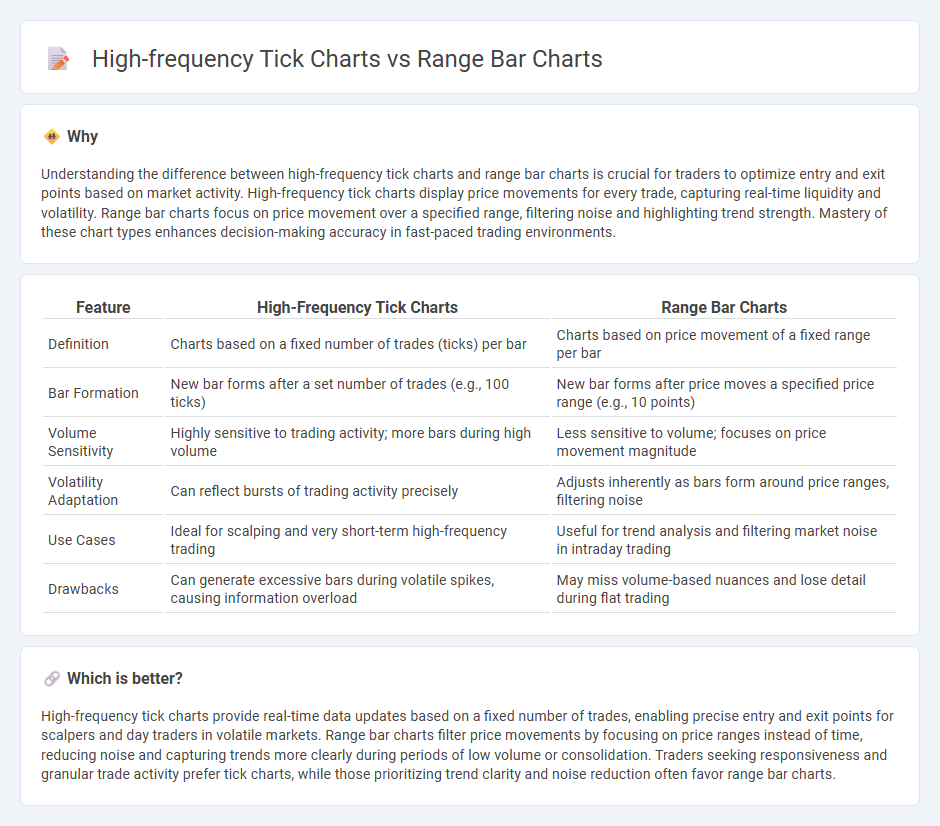
Understanding the difference between high-frequency tick charts and range bar charts is crucial for traders to optimize entry and exit points based on market activity. High-frequency tick charts display price movements for every trade, capturing real-time liquidity and volatility. Range bar charts focus on price movement over a specified range, filtering noise and highlighting trend strength. Mastery of these chart types enhances decision-making accuracy in fast-paced trading environments.
Comparison Table
| Feature | High-Frequency Tick Charts | Range Bar Charts |
|---|---|---|
| Definition | Charts based on a fixed number of trades (ticks) per bar | Charts based on price movement of a fixed range per bar |
| Bar Formation | New bar forms after a set number of trades (e.g., 100 ticks) | New bar forms after price moves a specified price range (e.g., 10 points) |
| Volume Sensitivity | Highly sensitive to trading activity; more bars during high volume | Less sensitive to volume; focuses on price movement magnitude |
| Volatility Adaptation | Can reflect bursts of trading activity precisely | Adjusts inherently as bars form around price ranges, filtering noise |
| Use Cases | Ideal for scalping and very short-term high-frequency trading | Useful for trend analysis and filtering market noise in intraday trading |
| Drawbacks | Can generate excessive bars during volatile spikes, causing information overload | May miss volume-based nuances and lose detail during flat trading |
Which is better?
High-frequency tick charts provide real-time data updates based on a fixed number of trades, enabling precise entry and exit points for scalpers and day traders in volatile markets. Range bar charts filter price movements by focusing on price ranges instead of time, reducing noise and capturing trends more clearly during periods of low volume or consolidation. Traders seeking responsiveness and granular trade activity prefer tick charts, while those prioritizing trend clarity and noise reduction often favor range bar charts.
Connection
High-frequency tick charts and range bar charts both offer precise market movement analysis by focusing on specific metrics rather than fixed time intervals. Tick charts track a set number of trades per bar, providing detailed insight into transaction frequency and volume, while range bar charts create bars based on price movement thresholds, filtering out noise from minor fluctuations. Their connection lies in delivering granular market data for traders to detect short-term trends and optimize entry and exit strategies in fast-paced trading environments.
Key Terms
Price movement sensitivity
Range bar charts emphasize price movement by creating bars based on fixed price ranges, enhancing sensitivity to volatility and filtering out time-driven noise. High-frequency tick charts focus on transaction count, offering detailed insights into order flow but may obscure subtle price fluctuations amid rapid trades. Explore how these chart types impact trading strategies and market analysis in greater depth.
Time independence
Range bar charts construct bars based on price movement rather than time intervals, enabling traders to focus on significant price changes without the noise of time-based data. High-frequency tick charts capture trades at fixed tick counts, providing granular insights into market activity while still influenced by variable time spans. Explore the detailed analysis of how time independence impacts trading strategies with these chart types for enhanced market understanding.
Noise filtering
Range bar charts filter noise by aggregating price movements into fixed price ranges, reducing the impact of time-based volatility and eliminating time intervals with minimal price changes. High-frequency tick charts, by plotting each tick regardless of time, capture more granular data but require advanced algorithms for noise filtering to avoid misleading signals from market microstructure noise. Explore deeper insights on how each chart type manages noise and enhances trading strategies.
Source and External Links
Range Bar Charts: Key Concepts for Smart Traders - Range bar charts focus on price movement instead of time, forming bars only after a specific price change occurs, which reduces noise and enhances trend clarity for traders.
Understanding Range Charts - Range bar charts generate a new bar only when the price moves by a user-defined value, ignoring time intervals, and are suited to highlight support and resistance levels especially for short-term trading.
Range Bar (RB) - Charts - Range bar charts are non-time-based and formed by price action outside the previous bar's range, helping to expose trends and volatility, with bars calculated from tick data according to specified price movements.