Footprint charts provide detailed market microstructure by visualizing volume, bid-ask data, and order flow, enabling traders to analyze price action with precision. Point and Figure charts focus on price movements and reversals without considering time, filtering out market noise to highlight significant trends. Explore the advantages of each chart type to enhance your trading strategy.
Why it is important
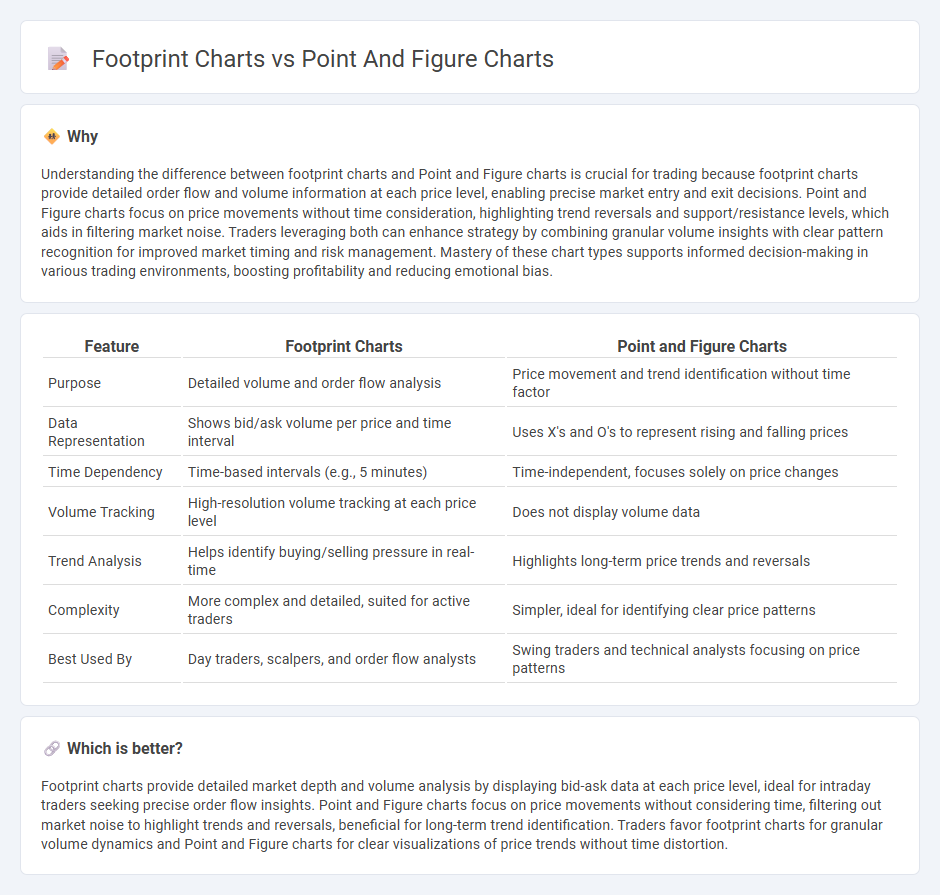
Understanding the difference between footprint charts and Point and Figure charts is crucial for trading because footprint charts provide detailed order flow and volume information at each price level, enabling precise market entry and exit decisions. Point and Figure charts focus on price movements without time consideration, highlighting trend reversals and support/resistance levels, which aids in filtering market noise. Traders leveraging both can enhance strategy by combining granular volume insights with clear pattern recognition for improved market timing and risk management. Mastery of these chart types supports informed decision-making in various trading environments, boosting profitability and reducing emotional bias.
Comparison Table
| Feature | Footprint Charts | Point and Figure Charts |
|---|---|---|
| Purpose | Detailed volume and order flow analysis | Price movement and trend identification without time factor |
| Data Representation | Shows bid/ask volume per price and time interval | Uses X's and O's to represent rising and falling prices |
| Time Dependency | Time-based intervals (e.g., 5 minutes) | Time-independent, focuses solely on price changes |
| Volume Tracking | High-resolution volume tracking at each price level | Does not display volume data |
| Trend Analysis | Helps identify buying/selling pressure in real-time | Highlights long-term price trends and reversals |
| Complexity | More complex and detailed, suited for active traders | Simpler, ideal for identifying clear price patterns |
| Best Used By | Day traders, scalpers, and order flow analysts | Swing traders and technical analysts focusing on price patterns |
Which is better?
Footprint charts provide detailed market depth and volume analysis by displaying bid-ask data at each price level, ideal for intraday traders seeking precise order flow insights. Point and Figure charts focus on price movements without considering time, filtering out market noise to highlight trends and reversals, beneficial for long-term trend identification. Traders favor footprint charts for granular volume dynamics and Point and Figure charts for clear visualizations of price trends without time distortion.
Connection
Footprint charts and Point and Figure charts both enhance trading analysis by providing unique insights into price action and market dynamics. Footprint charts display detailed volume at each price level within a specific time frame, allowing traders to assess buying and selling pressure, while Point and Figure charts focus solely on price movements without time, highlighting significant trends and support-resistance levels. Combining these chart types offers traders a comprehensive view of market structure, improving decision-making and trade execution accuracy.
Key Terms
Box Size (Point and Figure)
Point and Figure charts use box size to determine price movement granularity, filtering out market noise by recording only significant price changes, unlike footprint charts that display detailed volume and order flow data at each price level. Box size selection directly impacts the chart's sensitivity to price action, with smaller boxes capturing finer movements and larger boxes highlighting major trends. Explore the optimal box size strategies for Point and Figure charts to enhance your technical analysis precision.
Imbalance (Footprint)
Point and Figure charts highlight price movements by filtering out time and volume, focusing solely on supply and demand levels through price reversals. Footprint charts reveal detailed volume imbalances within each price bar, showing the exact number of contracts traded at bid and ask prices to identify aggressive buying or selling. Explore how combining Point and Figure charts with Footprint charts can enhance your trading strategies by pinpointing critical market imbalances.
Price Action
Point and Figure charts emphasize price movements by filtering out time and volume, highlighting pure supply and demand shifts through distinct price reversals. Footprint charts provide granular insight by displaying detailed volume distribution at each price level within specific time intervals, revealing precise order flow and market pressure. Explore how integrating these chart types enhances your price action analysis for sharper trading decisions.
Source and External Links
Point and figure chart - Wikipedia - Point and figure charts are a technical analysis tool focusing on price movements rather than time, using columns of X's and O's to mark rising and falling prices with configurable box sizes and reversal amounts to filter out minor price changes and effectively highlight trends and directional patterns.
Point and Figure Charting Guide - Incredible Charts - Point and Figure charts summarize market trends clearly by removing short-term noise and emphasize key support and resistance levels, making them useful tools for spotting trend movements and confirming market direction.
Introduction to Point & Figure Charts - ChartSchool - StockCharts.com - These charts identify support, resistance, and trend lines by plotting columns of X's for rising prices and O's for falling prices and use defined angles for bullish support and bearish resistance lines to analyze market patterns and price strength.