Order flow analysis dissects real-time market transactions and liquidity to provide precise insights into buying and selling pressure, unlike chart pattern analysis which interprets historical price movements and formations to predict trends. By examining order book data and trade executions, order flow offers a granular view of market sentiment that chart patterns may not reveal. Explore deeper nuances between these approaches to enhance your trading strategy effectiveness.
Why it is important
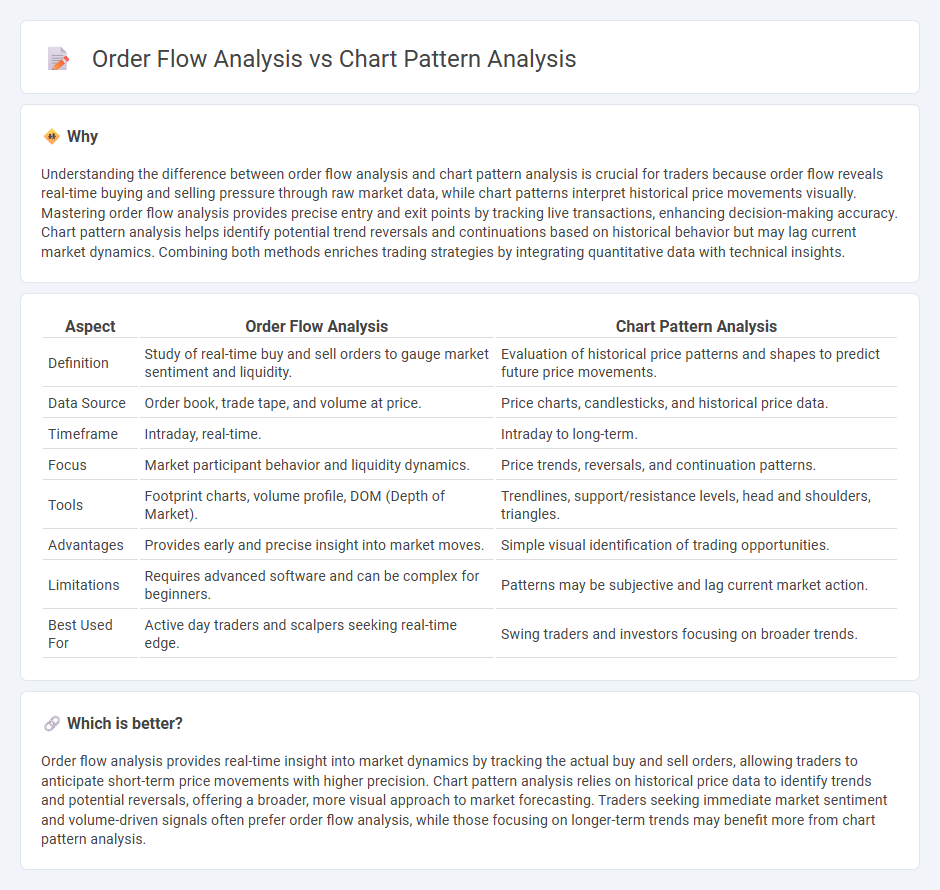
Understanding the difference between order flow analysis and chart pattern analysis is crucial for traders because order flow reveals real-time buying and selling pressure through raw market data, while chart patterns interpret historical price movements visually. Mastering order flow analysis provides precise entry and exit points by tracking live transactions, enhancing decision-making accuracy. Chart pattern analysis helps identify potential trend reversals and continuations based on historical behavior but may lag current market dynamics. Combining both methods enriches trading strategies by integrating quantitative data with technical insights.
Comparison Table
| Aspect | Order Flow Analysis | Chart Pattern Analysis |
|---|---|---|
| Definition | Study of real-time buy and sell orders to gauge market sentiment and liquidity. | Evaluation of historical price patterns and shapes to predict future price movements. |
| Data Source | Order book, trade tape, and volume at price. | Price charts, candlesticks, and historical price data. |
| Timeframe | Intraday, real-time. | Intraday to long-term. |
| Focus | Market participant behavior and liquidity dynamics. | Price trends, reversals, and continuation patterns. |
| Tools | Footprint charts, volume profile, DOM (Depth of Market). | Trendlines, support/resistance levels, head and shoulders, triangles. |
| Advantages | Provides early and precise insight into market moves. | Simple visual identification of trading opportunities. |
| Limitations | Requires advanced software and can be complex for beginners. | Patterns may be subjective and lag current market action. |
| Best Used For | Active day traders and scalpers seeking real-time edge. | Swing traders and investors focusing on broader trends. |
Which is better?
Order flow analysis provides real-time insight into market dynamics by tracking the actual buy and sell orders, allowing traders to anticipate short-term price movements with higher precision. Chart pattern analysis relies on historical price data to identify trends and potential reversals, offering a broader, more visual approach to market forecasting. Traders seeking immediate market sentiment and volume-driven signals often prefer order flow analysis, while those focusing on longer-term trends may benefit more from chart pattern analysis.
Connection
Order flow analysis and chart pattern analysis are interconnected through their focus on market sentiment and price movement. Order flow analysis provides real-time data on buy and sell orders, revealing trader intentions, while chart pattern analysis interprets these movements to predict potential price trends. Together, they enhance trading decisions by combining direct market data with visual trend recognition.
Key Terms
**Chart Pattern Analysis:**
Chart pattern analysis involves identifying specific shapes and formations on price charts, such as head and shoulders, triangles, and double tops, to predict future market movements based on historical price behavior. This method leverages technical indicators and volume data to validate patterns and enhance forecasting accuracy. Explore more about chart pattern analysis techniques and their practical applications in trading strategies.
Support and Resistance
Support and resistance levels in chart pattern analysis are identified through historical price patterns, trendlines, and key psychological price points where supply and demand balance shifts. Order flow analysis, however, examines real-time buy and sell orders, revealing supply and demand imbalances by tracking market participants' actual transactions at support and resistance zones. Discover how combining these approaches can provide a more comprehensive market entry and exit strategy.
Head and Shoulders
The Head and Shoulders pattern is a classic chart pattern signaling potential trend reversals, identified by three peaks with the middle peak (head) higher than the two shoulders. Order flow analysis complements this by revealing the real-time buying and selling pressure behind the pattern, using volume and trade data to confirm or question the breakout or breakdown. Explore in-depth strategies combining Head and Shoulders with order flow data to refine entry and exit points in trading.
Source and External Links
Learn basics & Types of Chart Patterns - Chart pattern analysis classifies patterns into reversal and continuation types, helping traders predict trend reversals or pauses before trend continuations, using recognizable shapes like head and shoulders, double tops/bottoms, triangles, flags, and more, supported by trendlines and volume analysis.
Chart Patterns in Technical Analysis: A Comprehensive Guide - Chart patterns reflect collective trader psychology showing group reactions like fear or excitement, which forms predictable price movements; these patterns are studied to anticipate future price action, often shaped by reactions to news or rumors.
The Only CHART PATTERNS Technical Analysis & ... - This video explains how to recognize and trade powerful chart patterns such as triangles (symmetrical, ascending, descending), channels, double tops, and bottoms, detailing how patterns signal trend reversals or continuations and their application in trading decisions.