eBPF (extended Berkeley Packet Filter) offers a powerful, flexible framework for deep kernel observability and dynamic tracing across various subsystems, surpassing the traditional capabilities of Ftrace by enabling custom programs to run safely within the Linux kernel. Ftrace, primarily focused on function tracing and latency measurement, provides essential but more limited insights into kernel behavior without the extensibility features found in eBPF. Explore more to understand how eBPF's versatility transforms system monitoring compared to Ftrace's specialized tracing functions.
Why it is important
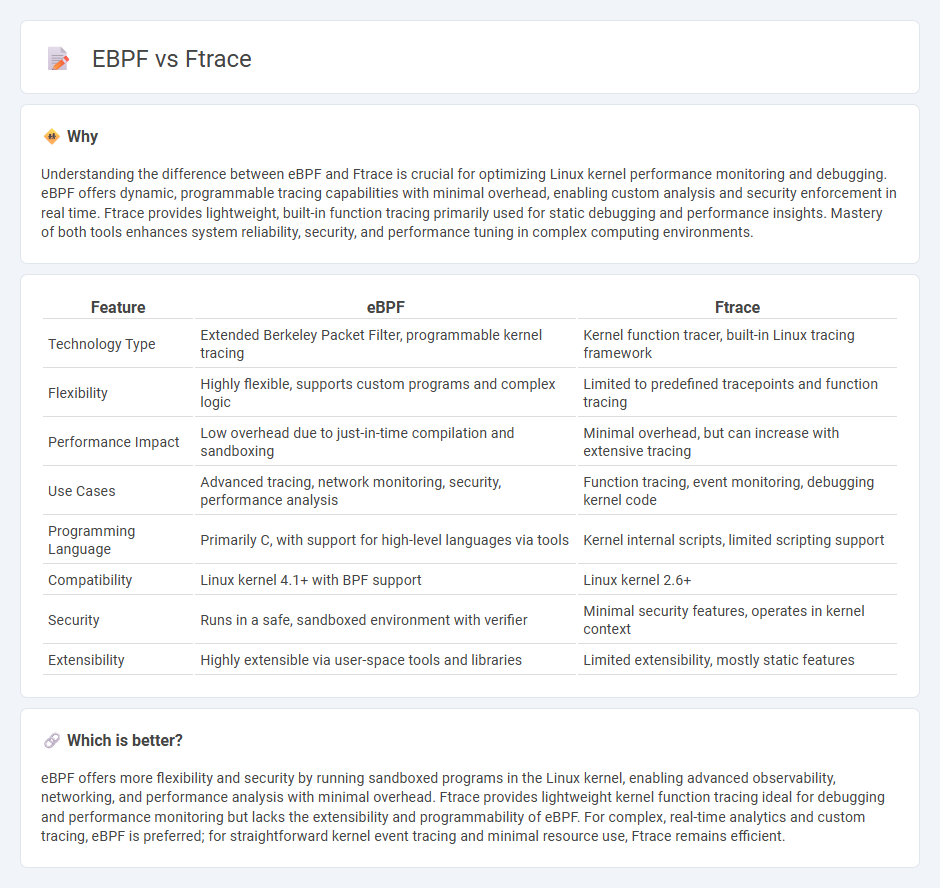
Understanding the difference between eBPF and Ftrace is crucial for optimizing Linux kernel performance monitoring and debugging. eBPF offers dynamic, programmable tracing capabilities with minimal overhead, enabling custom analysis and security enforcement in real time. Ftrace provides lightweight, built-in function tracing primarily used for static debugging and performance insights. Mastery of both tools enhances system reliability, security, and performance tuning in complex computing environments.
Comparison Table
| Feature | eBPF | Ftrace |
|---|---|---|
| Technology Type | Extended Berkeley Packet Filter, programmable kernel tracing | Kernel function tracer, built-in Linux tracing framework |
| Flexibility | Highly flexible, supports custom programs and complex logic | Limited to predefined tracepoints and function tracing |
| Performance Impact | Low overhead due to just-in-time compilation and sandboxing | Minimal overhead, but can increase with extensive tracing |
| Use Cases | Advanced tracing, network monitoring, security, performance analysis | Function tracing, event monitoring, debugging kernel code |
| Programming Language | Primarily C, with support for high-level languages via tools | Kernel internal scripts, limited scripting support |
| Compatibility | Linux kernel 4.1+ with BPF support | Linux kernel 2.6+ |
| Security | Runs in a safe, sandboxed environment with verifier | Minimal security features, operates in kernel context |
| Extensibility | Highly extensible via user-space tools and libraries | Limited extensibility, mostly static features |
Which is better?
eBPF offers more flexibility and security by running sandboxed programs in the Linux kernel, enabling advanced observability, networking, and performance analysis with minimal overhead. Ftrace provides lightweight kernel function tracing ideal for debugging and performance monitoring but lacks the extensibility and programmability of eBPF. For complex, real-time analytics and custom tracing, eBPF is preferred; for straightforward kernel event tracing and minimal resource use, Ftrace remains efficient.
Connection
eBPF (extended Berkeley Packet Filter) and Ftrace both serve as powerful Linux kernel tracing technologies that enhance system observability and debugging. eBPF extends Ftrace's capabilities by allowing dynamic, programmable tracing beyond static kernel instrumentation points, enabling custom monitoring and performance analysis. Together, they provide comprehensive insights into kernel behavior, facilitating advanced diagnostics and security monitoring.
Key Terms
Tracing
Ftrace is a Linux kernel tracer providing low-overhead, function-level profiling with built-in tracing events, ideal for detailed kernel function call analysis. eBPF extends tracing capabilities through programmable hooks, enabling dynamic, fine-grained monitoring and custom data collection beyond static tracepoints. Explore the strengths and use cases of Ftrace and eBPF to enhance your system performance analysis.
Kernel
Ftrace is a lightweight kernel tracer primarily designed for function tracing and performance monitoring within the Linux kernel, providing low overhead and detailed insight into function calls. eBPF extends kernel observability by enabling dynamic, programmable tracing and event processing, allowing custom monitoring and security enforcement without recompiling kernel code. Explore in-depth comparisons and use cases of Ftrace and eBPF to enhance Linux kernel diagnostics and performance tuning.
Observability
Ftrace provides low-overhead kernel tracing primarily for function call tracking and performance analysis in Linux, offering deep insights into kernel events with minimal impact on system performance. eBPF extends observability by enabling programmable, event-driven data collection across kernel and user space, allowing dynamic tracing, monitoring, and security enforcement with greater flexibility. Explore further to understand how combining Ftrace and eBPF enhances comprehensive system observability.
Source and External Links
ftrace: trace your kernel functions! - ftrace is a Linux kernel feature that dynamically inserts tracing instructions into kernel functions to trace their calls, useful for debugging without impacting performance when not in use.
ftrace - Function Tracer -- The Linux Kernel documentation - ftrace is an internal Linux kernel tracer framework used for debugging, performance analysis, and latency tracing by monitoring function calls and kernel events via tracepoints.
Quick Start Guide for Linux FTrace - ftrace is a powerful Linux kernel tracing utility that monitors kernel functions and events through different tracers, requiring kernel configuration and usually interaction via the tracefs filesystem.