Alternative data analytics leverages diverse, non-traditional data sources such as satellite imagery, social media trends, and transactional records to uncover unique investment insights beyond standard market metrics. Technical analysis focuses on historical price patterns and trading volumes using charts and indicators to predict future market movements. Explore how combining these approaches can enhance investment strategies and decision-making.
Why it is important
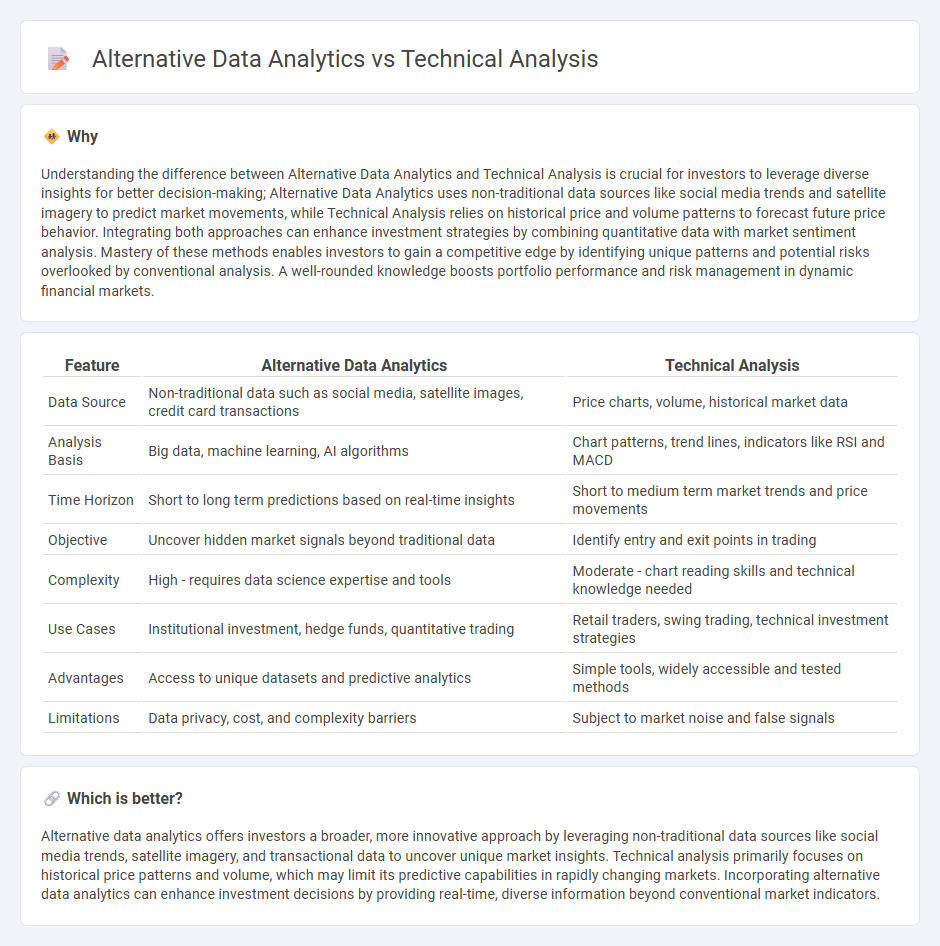
Understanding the difference between Alternative Data Analytics and Technical Analysis is crucial for investors to leverage diverse insights for better decision-making; Alternative Data Analytics uses non-traditional data sources like social media trends and satellite imagery to predict market movements, while Technical Analysis relies on historical price and volume patterns to forecast future price behavior. Integrating both approaches can enhance investment strategies by combining quantitative data with market sentiment analysis. Mastery of these methods enables investors to gain a competitive edge by identifying unique patterns and potential risks overlooked by conventional analysis. A well-rounded knowledge boosts portfolio performance and risk management in dynamic financial markets.
Comparison Table
| Feature | Alternative Data Analytics | Technical Analysis |
|---|---|---|
| Data Source | Non-traditional data such as social media, satellite images, credit card transactions | Price charts, volume, historical market data |
| Analysis Basis | Big data, machine learning, AI algorithms | Chart patterns, trend lines, indicators like RSI and MACD |
| Time Horizon | Short to long term predictions based on real-time insights | Short to medium term market trends and price movements |
| Objective | Uncover hidden market signals beyond traditional data | Identify entry and exit points in trading |
| Complexity | High - requires data science expertise and tools | Moderate - chart reading skills and technical knowledge needed |
| Use Cases | Institutional investment, hedge funds, quantitative trading | Retail traders, swing trading, technical investment strategies |
| Advantages | Access to unique datasets and predictive analytics | Simple tools, widely accessible and tested methods |
| Limitations | Data privacy, cost, and complexity barriers | Subject to market noise and false signals |
Which is better?
Alternative data analytics offers investors a broader, more innovative approach by leveraging non-traditional data sources like social media trends, satellite imagery, and transactional data to uncover unique market insights. Technical analysis primarily focuses on historical price patterns and volume, which may limit its predictive capabilities in rapidly changing markets. Incorporating alternative data analytics can enhance investment decisions by providing real-time, diverse information beyond conventional market indicators.
Connection
Alternative data analytics enhances technical analysis by incorporating non-traditional data sources such as satellite imagery, social media trends, and consumer transaction data to refine market predictions. Technical analysis relies on historical price and volume patterns, while alternative data provides supplementary insights that improve the accuracy of trend identification and algorithmic trading strategies. Integrating both approaches allows investors to gain a more comprehensive understanding of market dynamics and make data-driven investment decisions.
Key Terms
**Technical analysis:**
Technical analysis examines historical price movements and trading volumes to forecast future market trends using chart patterns, indicators, and oscillators like moving averages and RSI. It relies heavily on market data such as candlestick patterns and support-resistance levels to identify entry and exit points for trading strategies. Explore more about how technical analysis tools can enhance investment decision-making and risk management.
Chart patterns
Technical analysis relies on historical price movements and chart patterns such as head and shoulders, triangles, and double tops to forecast future market trends. Alternative data analytics uses non-traditional data sources like social media sentiment, satellite images, and transaction data to uncover insights that complement or challenge chart-based signals. Explore how integrating both methods can enhance market prediction accuracy and investment strategies.
Moving averages
Moving averages in technical analysis smooth price data to identify trends and potential reversal points, commonly utilizing simple moving averages (SMA) and exponential moving averages (EMA) to generate buy and sell signals based on crossover strategies. Alternative data analytics supplements traditional moving averages by incorporating non-price data such as social media sentiment, satellite imagery, and web traffic to provide a broader context for market movements and improve predictive accuracy. Explore deeper insights on combining moving averages with alternative datasets for enhanced trading strategies.
Source and External Links
Technical Analysis - A Beginner's Guide - Technical analysis is a method used to predict future price movements of securities based on market data and price action, assuming all relevant information is reflected in prices and that patterns repeat over time, with traders using different time frames and indicators suited to their style.
Beginners Guide to Technical Analysis | Learn to Trade - Technical analysis involves studying asset price charts and market statistics to identify trends, support and resistance levels, and apply tools like moving averages and momentum indicators to find high-probability trading opportunities.
Technical analysis - Technical analysis forecasts price direction by analyzing past market data and price trends, based on the principles that market prices reflect all information and tend to move in identifiable trends due to investors' patterned behavior.