Flood risk mapping utilizes hydrological data, topography, and rainfall patterns to predict areas prone to inundation and assess potential insurance losses. Wildfire susceptibility mapping focuses on vegetation types, climate conditions, and historical fire occurrences to evaluate the likelihood and impact of fire events on properties. Explore detailed comparisons of these risk assessment tools to enhance insurance strategies.
Why it is important
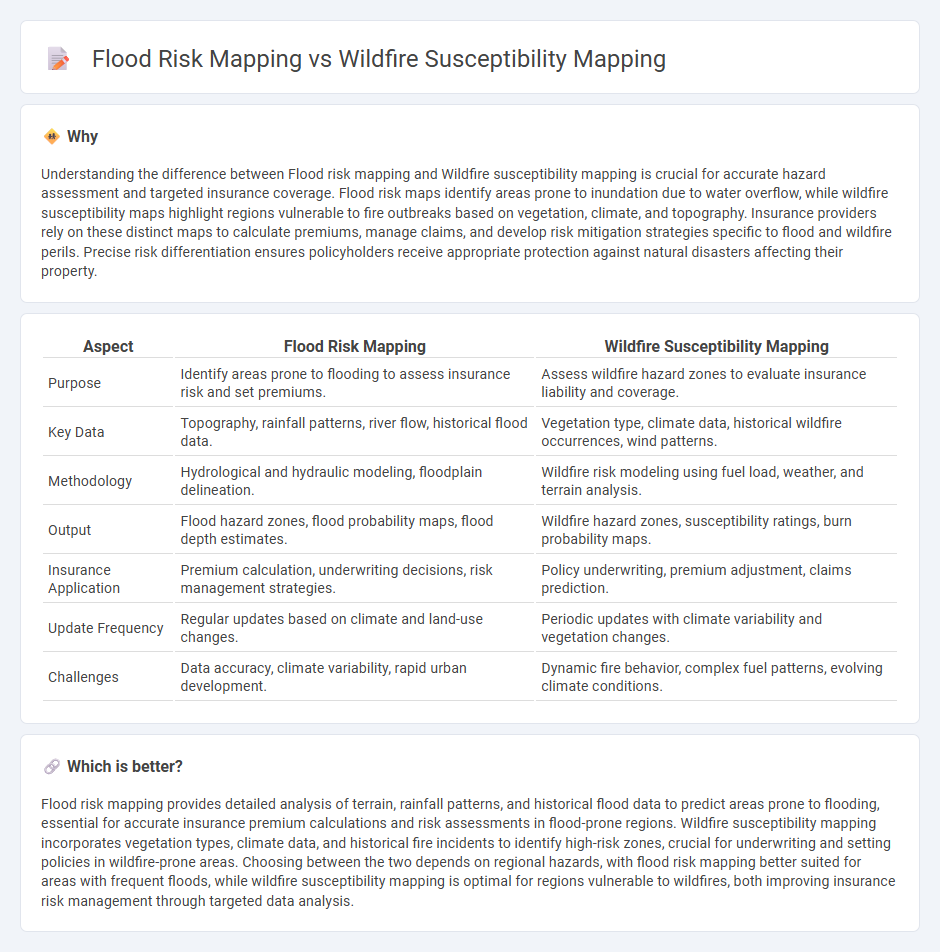
Understanding the difference between Flood risk mapping and Wildfire susceptibility mapping is crucial for accurate hazard assessment and targeted insurance coverage. Flood risk maps identify areas prone to inundation due to water overflow, while wildfire susceptibility maps highlight regions vulnerable to fire outbreaks based on vegetation, climate, and topography. Insurance providers rely on these distinct maps to calculate premiums, manage claims, and develop risk mitigation strategies specific to flood and wildfire perils. Precise risk differentiation ensures policyholders receive appropriate protection against natural disasters affecting their property.
Comparison Table
| Aspect | Flood Risk Mapping | Wildfire Susceptibility Mapping |
|---|---|---|
| Purpose | Identify areas prone to flooding to assess insurance risk and set premiums. | Assess wildfire hazard zones to evaluate insurance liability and coverage. |
| Key Data | Topography, rainfall patterns, river flow, historical flood data. | Vegetation type, climate data, historical wildfire occurrences, wind patterns. |
| Methodology | Hydrological and hydraulic modeling, floodplain delineation. | Wildfire risk modeling using fuel load, weather, and terrain analysis. |
| Output | Flood hazard zones, flood probability maps, flood depth estimates. | Wildfire hazard zones, susceptibility ratings, burn probability maps. |
| Insurance Application | Premium calculation, underwriting decisions, risk management strategies. | Policy underwriting, premium adjustment, claims prediction. |
| Update Frequency | Regular updates based on climate and land-use changes. | Periodic updates with climate variability and vegetation changes. |
| Challenges | Data accuracy, climate variability, rapid urban development. | Dynamic fire behavior, complex fuel patterns, evolving climate conditions. |
Which is better?
Flood risk mapping provides detailed analysis of terrain, rainfall patterns, and historical flood data to predict areas prone to flooding, essential for accurate insurance premium calculations and risk assessments in flood-prone regions. Wildfire susceptibility mapping incorporates vegetation types, climate data, and historical fire incidents to identify high-risk zones, crucial for underwriting and setting policies in wildfire-prone areas. Choosing between the two depends on regional hazards, with flood risk mapping better suited for areas with frequent floods, while wildfire susceptibility mapping is optimal for regions vulnerable to wildfires, both improving insurance risk management through targeted data analysis.
Connection
Flood risk mapping and wildfire susceptibility mapping are interconnected through their roles in comprehensive disaster risk management and insurance underwriting, as both identify geographic areas prone to natural hazards. Accurate flood and wildfire risk assessments enable insurers to determine premium rates, coverage options, and mitigation requirements based on location-specific vulnerabilities. Integrating these hazard maps supports resilient community planning and reduces overall financial exposure for insurance providers.
Key Terms
Hazard Zonation
Wildfire susceptibility mapping employs satellite data, vegetation types, and climatic variables to delineate hazard zonation areas prone to fire outbreaks, enabling targeted mitigation strategies. Flood risk mapping integrates hydrological models, land elevation data, and rainfall patterns to identify flood-prone zones and inform urban planning and emergency response. Explore detailed methodologies and case studies for hazard zonation in wildfire and flood risk mapping to enhance disaster management frameworks.
Vulnerability Assessment
Wildfire susceptibility mapping identifies areas prone to fire outbreaks by analyzing factors such as vegetation type, topography, and climate conditions, while flood risk mapping evaluates regions susceptible to flooding based on rainfall intensity, river discharge, and land elevation. Vulnerability assessment in wildfire mapping emphasizes exposure, sensitivity, and adaptive capacity of both ecosystems and communities to fire hazards, whereas flood risk vulnerability focuses on infrastructure resilience, population density, and floodplain characteristics. Explore detailed methodologies and case studies to deepen your understanding of effective vulnerability assessments in disaster risk management.
Loss Estimation
Wildfire susceptibility mapping identifies areas prone to fire outbreaks based on vegetation, topography, and climate data, enabling targeted loss estimation of property and ecological damage. Flood risk mapping assesses inundation zones using hydrological models and historical flood data, quantifying potential economic and infrastructural losses. Explore detailed methodologies and comparative analyses to enhance disaster management strategies.
Source and External Links
GeoAI-Based Forest Fire Susceptibility Assessment with Integration - This study uses multiple machine learning models (Random Forest, Logistic Regression, SVM) combined with forest and soil data to accurately map wildfire susceptibility zones, demonstrating Random Forest as the most accurate for Gangwon Province.
Wildfire Susceptibility Mapping Using Five Boosting Machine Learning Algorithms: The Case Study of the Mediterranean Region of Turkey - The research applies and compares boosting algorithms like CatBoost and LightGBM for wildfire susceptibility mapping, achieving high predictive accuracy and providing valuable tools for forest management and disaster planning.
Wildfire | National Risk Index - Mapping Information Platform - FEMA - FEMA's National Risk Index creates wildfire risk and susceptibility maps based on factors such as expected losses, exposure, historic loss ratio, and hazard frequency using forest service data.