Data visualization dashboards transform complex accounting data into interactive, easy-to-understand graphics that highlight key performance indicators and financial trends. Transaction logs provide a detailed, chronological record of all financial activities, essential for auditing and compliance. Explore how combining both tools enhances financial analysis and decision-making.
Why it is important
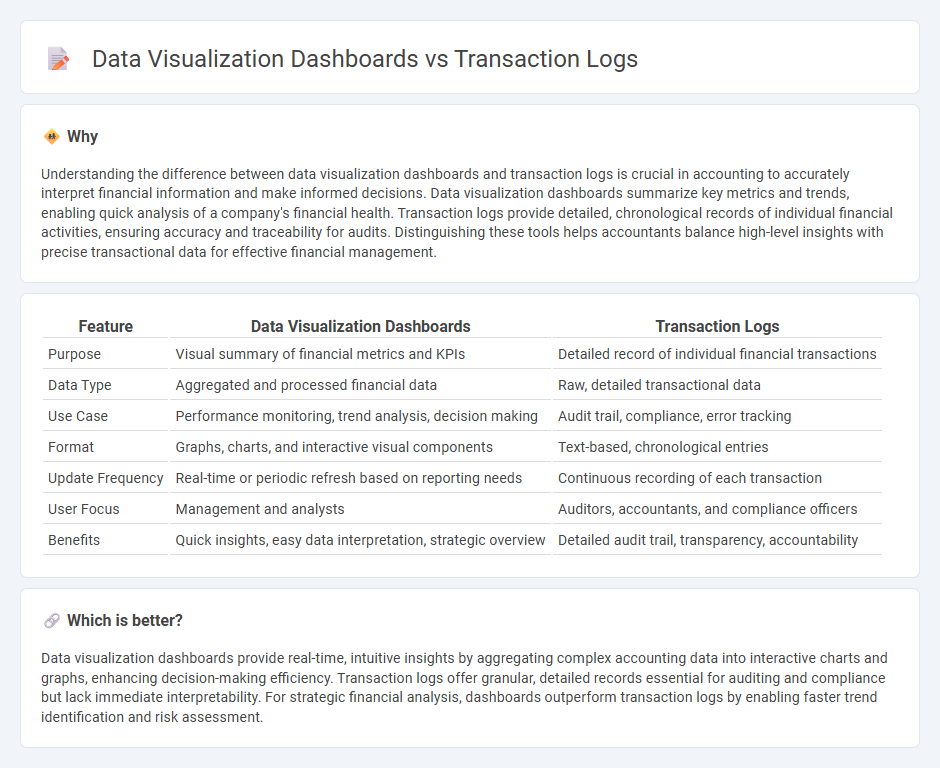
Understanding the difference between data visualization dashboards and transaction logs is crucial in accounting to accurately interpret financial information and make informed decisions. Data visualization dashboards summarize key metrics and trends, enabling quick analysis of a company's financial health. Transaction logs provide detailed, chronological records of individual financial activities, ensuring accuracy and traceability for audits. Distinguishing these tools helps accountants balance high-level insights with precise transactional data for effective financial management.
Comparison Table
| Feature | Data Visualization Dashboards | Transaction Logs |
|---|---|---|
| Purpose | Visual summary of financial metrics and KPIs | Detailed record of individual financial transactions |
| Data Type | Aggregated and processed financial data | Raw, detailed transactional data |
| Use Case | Performance monitoring, trend analysis, decision making | Audit trail, compliance, error tracking |
| Format | Graphs, charts, and interactive visual components | Text-based, chronological entries |
| Update Frequency | Real-time or periodic refresh based on reporting needs | Continuous recording of each transaction |
| User Focus | Management and analysts | Auditors, accountants, and compliance officers |
| Benefits | Quick insights, easy data interpretation, strategic overview | Detailed audit trail, transparency, accountability |
Which is better?
Data visualization dashboards provide real-time, intuitive insights by aggregating complex accounting data into interactive charts and graphs, enhancing decision-making efficiency. Transaction logs offer granular, detailed records essential for auditing and compliance but lack immediate interpretability. For strategic financial analysis, dashboards outperform transaction logs by enabling faster trend identification and risk assessment.
Connection
Data visualization dashboards in accounting provide real-time insights by aggregating and analyzing transaction logs, enabling accurate tracking of financial activities. Transaction logs serve as the primary data source, recording every financial event that supports detailed and transparent visual reports. This connection enhances decision-making, audit readiness, and regulatory compliance through clear representation of transactional data.
Key Terms
Audit Trail
Transaction logs serve as detailed records capturing every action within a system, essential for maintaining a comprehensive audit trail that ensures accountability and traceability. Data visualization dashboards provide real-time summaries and graphical representations of data trends but typically lack the granular specificity required for thorough audits. Explore the distinct roles of transaction logs and dashboards to enhance your organization's audit trail capabilities.
Real-time Reporting
Transaction logs capture detailed records of every user interaction and system event, providing raw data essential for real-time reporting accuracy. Data visualization dashboards transform this granular data into intuitive, interactive charts and graphs that facilitate rapid decision-making processes. Explore comprehensive insights into how these tools enhance real-time reporting effectiveness and operational transparency.
Data Integrity
Transaction logs provide a detailed, immutable record of all database operations, ensuring data integrity by enabling accurate tracking and auditing of every change. Data visualization dashboards synthesize this underlying transaction data into interactive graphs and charts, offering insights without compromising the fidelity of the original records. Explore how combining transaction logs with advanced dashboards enhances data integrity and operational transparency.
Source and External Links
Transaction logging - Operations Manual - Neo4j - Transaction logs are files that record all changes made in a database as part of each transaction, including data, indexes, and constraints, used for ensuring consistency, backups, and cluster operations.
The transactions log - IBM - Each Planning Analytics database logs all data changes by clients in a tm1s.log file, recording details like timestamps, client name, before/after values, and cube information for auditing and recovery purposes.
SQL Server transaction log architecture and management guide - SQL Server transaction logs record every transaction and modification, with log records identified by sequence numbers that are used to maintain the order of changes and support rollback operations.
 dowidth.com