Quantitative sentiment analysis leverages data from social media, news, and financial reports to gauge market emotions and predict stock movements with statistical models. Technical analysis focuses on historical price patterns, volume, and chart indicators to identify trends and potential entry or exit points. Explore how integrating these methods can enhance trading strategies and market predictions.
Why it is important
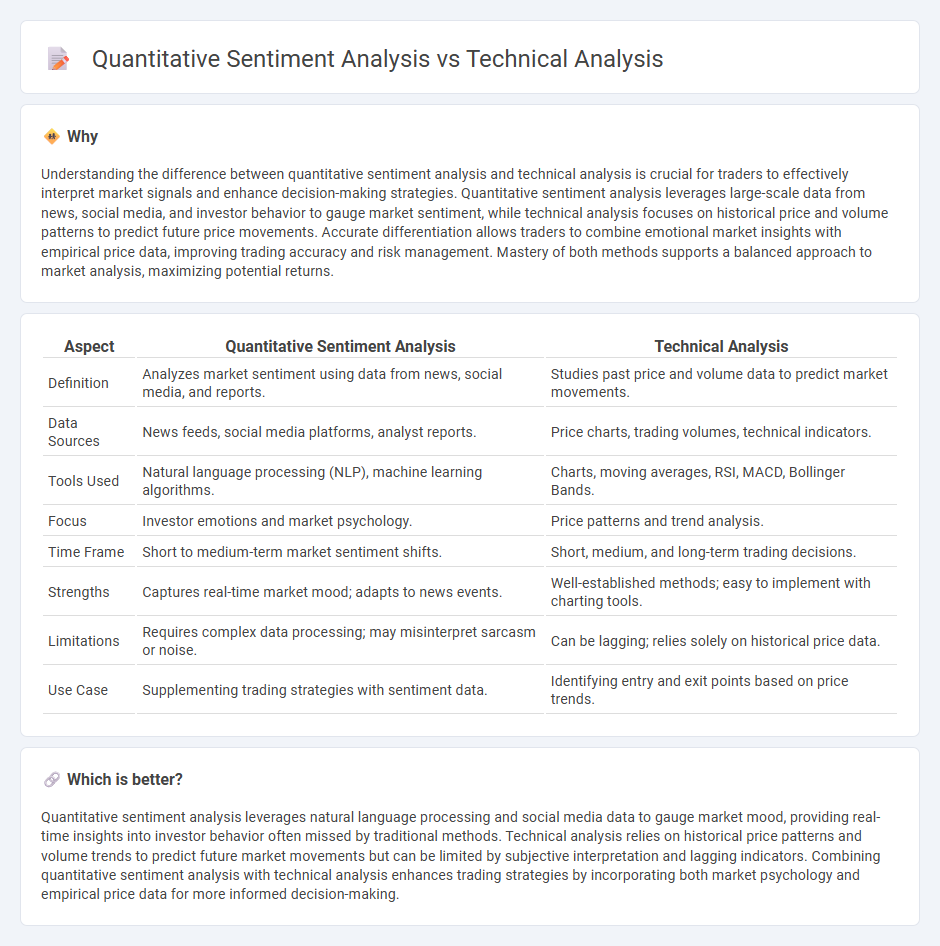
Understanding the difference between quantitative sentiment analysis and technical analysis is crucial for traders to effectively interpret market signals and enhance decision-making strategies. Quantitative sentiment analysis leverages large-scale data from news, social media, and investor behavior to gauge market sentiment, while technical analysis focuses on historical price and volume patterns to predict future price movements. Accurate differentiation allows traders to combine emotional market insights with empirical price data, improving trading accuracy and risk management. Mastery of both methods supports a balanced approach to market analysis, maximizing potential returns.
Comparison Table
| Aspect | Quantitative Sentiment Analysis | Technical Analysis |
|---|---|---|
| Definition | Analyzes market sentiment using data from news, social media, and reports. | Studies past price and volume data to predict market movements. |
| Data Sources | News feeds, social media platforms, analyst reports. | Price charts, trading volumes, technical indicators. |
| Tools Used | Natural language processing (NLP), machine learning algorithms. | Charts, moving averages, RSI, MACD, Bollinger Bands. |
| Focus | Investor emotions and market psychology. | Price patterns and trend analysis. |
| Time Frame | Short to medium-term market sentiment shifts. | Short, medium, and long-term trading decisions. |
| Strengths | Captures real-time market mood; adapts to news events. | Well-established methods; easy to implement with charting tools. |
| Limitations | Requires complex data processing; may misinterpret sarcasm or noise. | Can be lagging; relies solely on historical price data. |
| Use Case | Supplementing trading strategies with sentiment data. | Identifying entry and exit points based on price trends. |
Which is better?
Quantitative sentiment analysis leverages natural language processing and social media data to gauge market mood, providing real-time insights into investor behavior often missed by traditional methods. Technical analysis relies on historical price patterns and volume trends to predict future market movements but can be limited by subjective interpretation and lagging indicators. Combining quantitative sentiment analysis with technical analysis enhances trading strategies by incorporating both market psychology and empirical price data for more informed decision-making.
Connection
Quantitative sentiment analysis leverages natural language processing to extract market sentiment from news, social media, and financial reports, providing data-driven indicators that complement technical analysis patterns such as moving averages and RSI. Integrating sentiment scores with technical indicators enhances predictive accuracy by capturing trader psychology and market momentum simultaneously. This connection enables traders to identify potential entry and exit points with improved confidence in volatile market conditions.
Key Terms
**Technical Analysis:**
Technical analysis examines historical price patterns and trading volumes using tools like moving averages, RSI, and Fibonacci retracements to predict future market trends. It relies on chart patterns and market psychology to identify potential entry and exit points, providing traders with actionable signals. Explore deeper insights into technical analysis techniques and strategies to enhance trading decisions.
Chart Patterns
Technical analysis relies on historical price data and chart patterns such as head and shoulders, triangles, and flags to identify potential market trends and reversals. Quantitative sentiment analysis incorporates large datasets from news, social media, and financial reports to measure market sentiment and predict price movements with statistical models. Explore advanced methods and tools that combine chart patterns with sentiment data for enhanced trading strategies.
Technical Indicators
Technical analysis utilizes historical price data through technical indicators like moving averages, Relative Strength Index (RSI), and Bollinger Bands to predict future market trends. Quantitative sentiment analysis incorporates data-driven sentiment scores derived from news, social media, and market sentiment indicators to gauge investor emotions influencing price movements. Explore the differences and applications of both methods to enhance your trading strategy.
Source and External Links
Technical Analysis - A Beginner's Guide - Corporate Finance Institute - Technical analysis is a method used to predict the future price movement of securities by analyzing past market data and price charts, emphasizing that market prices reflect all relevant information and trends tend to persist over various timeframes depending on trading style.
Beginners Guide to Technical Analysis | Learn to Trade - Oanda - Technical analysis involves studying historical price charts to identify trends, support and resistance levels, and using tools like moving averages and oscillators to forecast price direction and take high probability trades.
Technical analysis - Wikipedia - This methodology analyzes past market data to forecast price directions based on the principle that price patterns reflect all known information and tend to repeat due to investor behavior, focusing on market trends and price action rather than external fundamental factors.