The quits rate, indicating workers voluntarily leaving jobs, often signals confidence in the labor market and economic growth, while the layoff rate reflects involuntary job separations tied to economic downturns or company restructuring. Analyzing the balance between quits and layoffs provides crucial insights into workforce stability, employer demand, and overall economic health. Explore the relationship between quits rate and layoff rate to better understand labor market dynamics and economic trends.
Why it is important
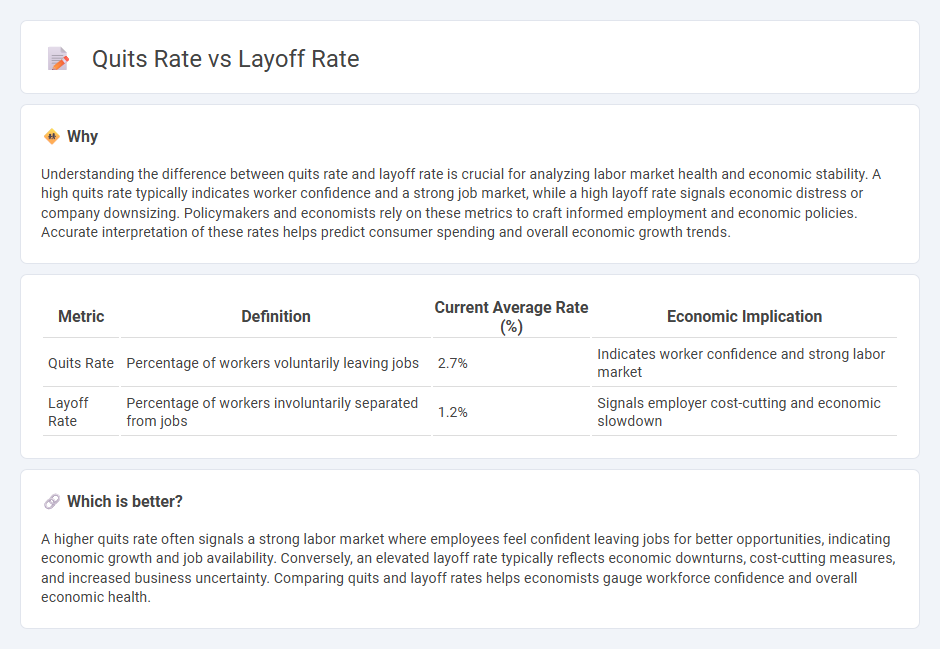
Understanding the difference between quits rate and layoff rate is crucial for analyzing labor market health and economic stability. A high quits rate typically indicates worker confidence and a strong job market, while a high layoff rate signals economic distress or company downsizing. Policymakers and economists rely on these metrics to craft informed employment and economic policies. Accurate interpretation of these rates helps predict consumer spending and overall economic growth trends.
Comparison Table
| Metric | Definition | Current Average Rate (%) | Economic Implication |
|---|---|---|---|
| Quits Rate | Percentage of workers voluntarily leaving jobs | 2.7% | Indicates worker confidence and strong labor market |
| Layoff Rate | Percentage of workers involuntarily separated from jobs | 1.2% | Signals employer cost-cutting and economic slowdown |
Which is better?
A higher quits rate often signals a strong labor market where employees feel confident leaving jobs for better opportunities, indicating economic growth and job availability. Conversely, an elevated layoff rate typically reflects economic downturns, cost-cutting measures, and increased business uncertainty. Comparing quits and layoff rates helps economists gauge workforce confidence and overall economic health.
Connection
Quits rate and layoff rate are key labor market indicators that often show inverse trends, reflecting economic health and worker confidence. A rising quits rate typically signals strong job opportunities and worker optimism, while an increasing layoff rate points to economic downturns and employer cost-cutting. Monitoring these rates together provides critical insights into employment dynamics, business cycles, and overall economic stability.
Key Terms
Labor Turnover
Labor turnover measures the rate at which employees leave a company, with layoff rates reflecting involuntary separations due to organizational downsizing and quits rates indicating voluntary departures driven by employee choice. High quit rates often signal a competitive labor market or dissatisfaction, while elevated layoff rates may point to economic challenges or restructuring efforts. Explore deeper insights into labor turnover trends and their impact on workforce stability.
Workforce Mobility
The layoff rate measures the share of workers involuntarily separated from employment, while the quits rate reflects voluntary workforce mobility driven by employee confidence and job opportunities. High quits rates often signal a robust labor market where workers feel secure in finding new positions, whereas elevated layoff rates indicate economic distress or organizational restructuring. Explore deeper insights into workforce mobility by examining how these rates influence labor market trends and economic resilience.
Employment Dynamics
The layoff rate measures the percentage of workers involuntarily separated from their jobs, while the quits rate tracks voluntary employee departures, reflecting labor market confidence and economic conditions. Employment dynamics reveal that a rising quits rate often signals strong job availability and worker optimism, whereas an increasing layoff rate may indicate economic downturns or company restructuring. Explore how fluctuations in both rates impact workforce stability and labor market trends to better understand employment dynamics.
Source and External Links
How many people are laid off in the United States each month? - The layoff and discharge rate in the U.S. was 1.0% in May 2025, with about 1.6 million people laid off or discharged that month, a 2.4% increase over May 2024.
United States Job Layoffs And Discharges - Trading Economics - U.S. job layoffs and discharges averaged about 1.9 million annually since 2000, peaking at over 13 million in March 2020, and recorded 1.6 million in May 2025.
Layoffs and Discharges (Levels and Rates) | FRED | St. Louis Fed - Provides detailed monthly and sector-specific layoff and discharge data from 2000 through May 2025, including seasonally adjusted levels and rates for various industries.