The quits rate measures the percentage of workers voluntarily leaving their jobs, serving as a key indicator of labor market confidence and economic health. The Beveridge curve illustrates the relationship between job vacancies and unemployment, highlighting the efficiency of labor market matching. Explore the intricate dynamics between quits rate and the Beveridge curve to better understand employment trends.
Why it is important
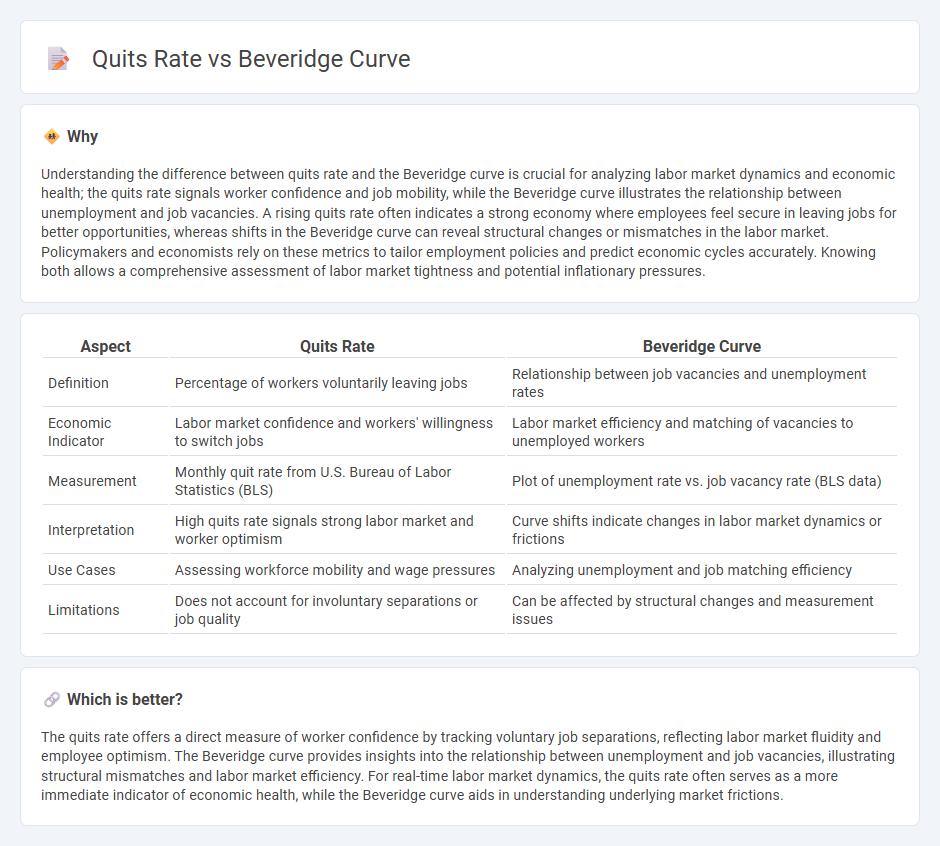
Understanding the difference between quits rate and the Beveridge curve is crucial for analyzing labor market dynamics and economic health; the quits rate signals worker confidence and job mobility, while the Beveridge curve illustrates the relationship between unemployment and job vacancies. A rising quits rate often indicates a strong economy where employees feel secure in leaving jobs for better opportunities, whereas shifts in the Beveridge curve can reveal structural changes or mismatches in the labor market. Policymakers and economists rely on these metrics to tailor employment policies and predict economic cycles accurately. Knowing both allows a comprehensive assessment of labor market tightness and potential inflationary pressures.
Comparison Table
| Aspect | Quits Rate | Beveridge Curve |
|---|---|---|
| Definition | Percentage of workers voluntarily leaving jobs | Relationship between job vacancies and unemployment rates |
| Economic Indicator | Labor market confidence and workers' willingness to switch jobs | Labor market efficiency and matching of vacancies to unemployed workers |
| Measurement | Monthly quit rate from U.S. Bureau of Labor Statistics (BLS) | Plot of unemployment rate vs. job vacancy rate (BLS data) |
| Interpretation | High quits rate signals strong labor market and worker optimism | Curve shifts indicate changes in labor market dynamics or frictions |
| Use Cases | Assessing workforce mobility and wage pressures | Analyzing unemployment and job matching efficiency |
| Limitations | Does not account for involuntary separations or job quality | Can be affected by structural changes and measurement issues |
Which is better?
The quits rate offers a direct measure of worker confidence by tracking voluntary job separations, reflecting labor market fluidity and employee optimism. The Beveridge curve provides insights into the relationship between unemployment and job vacancies, illustrating structural mismatches and labor market efficiency. For real-time labor market dynamics, the quits rate often serves as a more immediate indicator of economic health, while the Beveridge curve aids in understanding underlying market frictions.
Connection
The quits rate, a key indicator of worker confidence, directly influences the shape of the Beveridge curve by reflecting labor market fluidity and matching efficiency between job vacancies and unemployment. High quits rates typically signal robust job opportunities, shifting the Beveridge curve inward as unemployment falls relative to vacancies. Conversely, a declining quits rate can indicate labor market slack, causing the Beveridge curve to shift outward and highlighting frictions in job matching.
Key Terms
Labor Market Tightness
The Beveridge curve illustrates the inverse relationship between job vacancies and unemployment, highlighting labor market efficiency and matching efficiency, while the quits rate reflects worker confidence and labor market tightness by measuring voluntary separations. Higher quits rates typically indicate tighter labor markets, where workers feel confident about finding better opportunities, which often shifts the Beveridge curve inward, signaling improved matching. Explore how these dynamics interact to provide deeper insights into labor market fluctuations and policy implications.
Job Openings
The Beveridge curve illustrates the inverse relationship between job openings and unemployment, demonstrating labor market efficiency, while the quits rate measures the proportion of employees voluntarily leaving their jobs, reflecting worker confidence and job mobility. High job openings combined with an elevated quits rate suggest strong labor demand and a dynamic job market. Explore further to understand how these indicators interact to shape employment trends.
Voluntary Turnover
The Beveridge curve illustrates the inverse relationship between job vacancies and unemployment rates, highlighting labor market efficiency, while the quits rate specifically measures voluntary turnover, indicating worker confidence and mobility. High quits rates often signal a strong labor market where employees feel secure to leave jobs for better opportunities, complementing the interpretation of the Beveridge curve. Explore more to understand how these metrics together provide insights into voluntary turnover trends and labor market dynamics.
Source and External Links
Beveridge curve - The Beveridge curve is a graphical representation showing the inverse relationship between unemployment and the job vacancy rate, typically downward sloping, indicating labour market efficiency and shifts revealing changes in matching between jobs and unemployed workers.
What does the Beveridge curve tell us about the likelihood of a soft landing? - The Beveridge curve can be derived from steady-state unemployment dynamics, where flows into unemployment equal flows out, and it closely tracks actual unemployment by relating separation and job-finding rates.
Job vacancy and unemployment rates - Beveridge curve - The Beveridge curve illustrates how labour market tightness fluctuates with the business cycle, with shifts representing changes in the efficiency of matching unemployed workers to vacancies influenced by structural or informational factors.
 dowidth.com