Data visualization dashboards transform complex accounting data into interactive charts and graphs, enabling real-time insights and streamlined decision-making. Financial statements provide standardized reports showcasing a company's financial performance, including balance sheets, income statements, and cash flow statements. Explore how integrating dashboards with traditional financial statements can revolutionize your accounting analysis.
Why it is important
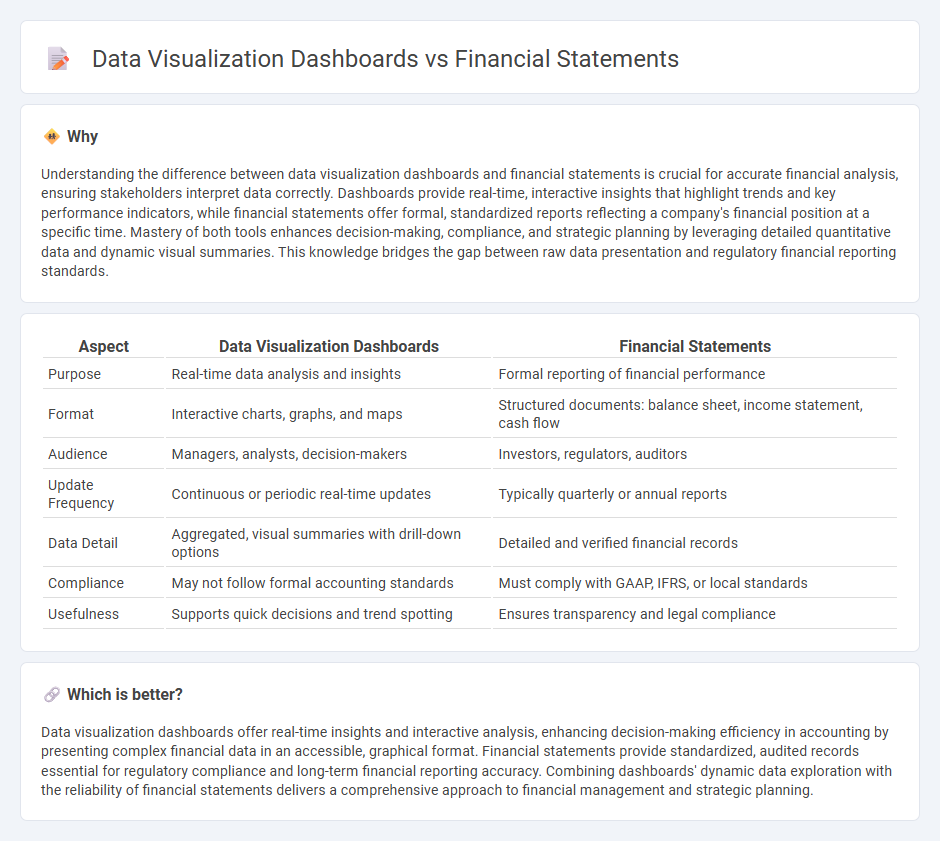
Understanding the difference between data visualization dashboards and financial statements is crucial for accurate financial analysis, ensuring stakeholders interpret data correctly. Dashboards provide real-time, interactive insights that highlight trends and key performance indicators, while financial statements offer formal, standardized reports reflecting a company's financial position at a specific time. Mastery of both tools enhances decision-making, compliance, and strategic planning by leveraging detailed quantitative data and dynamic visual summaries. This knowledge bridges the gap between raw data presentation and regulatory financial reporting standards.
Comparison Table
| Aspect | Data Visualization Dashboards | Financial Statements |
|---|---|---|
| Purpose | Real-time data analysis and insights | Formal reporting of financial performance |
| Format | Interactive charts, graphs, and maps | Structured documents: balance sheet, income statement, cash flow |
| Audience | Managers, analysts, decision-makers | Investors, regulators, auditors |
| Update Frequency | Continuous or periodic real-time updates | Typically quarterly or annual reports |
| Data Detail | Aggregated, visual summaries with drill-down options | Detailed and verified financial records |
| Compliance | May not follow formal accounting standards | Must comply with GAAP, IFRS, or local standards |
| Usefulness | Supports quick decisions and trend spotting | Ensures transparency and legal compliance |
Which is better?
Data visualization dashboards offer real-time insights and interactive analysis, enhancing decision-making efficiency in accounting by presenting complex financial data in an accessible, graphical format. Financial statements provide standardized, audited records essential for regulatory compliance and long-term financial reporting accuracy. Combining dashboards' dynamic data exploration with the reliability of financial statements delivers a comprehensive approach to financial management and strategic planning.
Connection
Data visualization dashboards integrate financial statements by transforming raw accounting data into interactive graphs and charts that enhance interpretation of income, expenses, assets, and liabilities. These dashboards enable real-time monitoring of key financial metrics such as revenue trends, profit margins, and cash flow, allowing for quicker decision-making and improved financial analysis. By linking to balance sheets, income statements, and cash flow statements, visualization tools provide a comprehensive view of a company's financial health.
Key Terms
Balance Sheet
Financial statements present the Balance Sheet through structured reports detailing assets, liabilities, and equity at a specific point in time, ensuring compliance with accounting standards. Data visualization dashboards transform this data into interactive charts and graphs, enabling quicker insights and trend analysis through real-time updates and comparison features. Explore how integrating both methods can enhance your financial analysis and decision-making processes.
Income Statement
Income statements provide a detailed summary of a company's revenues, expenses, and net profit during a specific period, delivering essential financial insights for performance evaluation. Data visualization dashboards transform this information into interactive charts and graphs, facilitating quick trend analysis and decision-making by highlighting key metrics such as gross profit margin and operating expenses. Explore how integrating income statement data with advanced visualization tools can enhance your financial analysis efficiency.
Key Performance Indicators (KPIs)
Financial statements provide a comprehensive overview of a company's financial health by detailing revenues, expenses, assets, liabilities, and equity, essential for assessing profitability and financial stability. Data visualization dashboards enhance decision-making by presenting real-time Key Performance Indicators (KPIs) such as revenue growth, profit margins, and return on investment in an interactive, easily digestible format. Explore how integrating both tools can optimize financial analysis and strategic planning.
Source and External Links
The Ultimate Guide to the Three Financial Statements - The three core financial statements are the income statement, balance sheet, and cash flow statement, each providing a unique view of a company's financial health and performance.
What are financial statements? - Financial statements are a set of documents, including the balance sheet, income statement, cash flow statement, and statement of retained earnings, that present a company's financial status at a specific point in time and are essential for decision-making and planning.
4 Types of Financial Statements & How They're Used - There are four primary financial statements: balance sheet, income statement, cash flow statement, and statement of shareholders' equity, each offering distinct data to analyze a company's financial performance and guide strategic decisions.