Data visualization dashboards enhance accounting processes by transforming complex financial data into interactive, real-time visual insights that improve decision-making. Unlike traditional accounting reports, dashboards offer dynamic analytics and customizable views that enable quicker identification of trends and anomalies. Explore how integrating data visualization dashboards can revolutionize your accounting workflow and financial analysis.
Why it is important
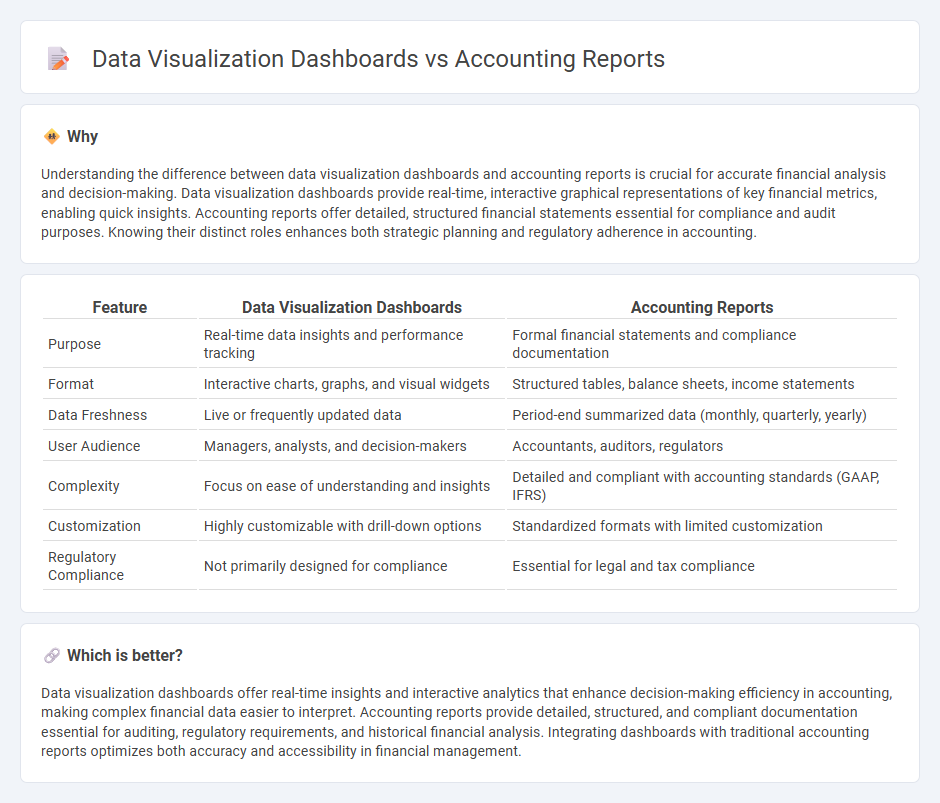
Understanding the difference between data visualization dashboards and accounting reports is crucial for accurate financial analysis and decision-making. Data visualization dashboards provide real-time, interactive graphical representations of key financial metrics, enabling quick insights. Accounting reports offer detailed, structured financial statements essential for compliance and audit purposes. Knowing their distinct roles enhances both strategic planning and regulatory adherence in accounting.
Comparison Table
| Feature | Data Visualization Dashboards | Accounting Reports |
|---|---|---|
| Purpose | Real-time data insights and performance tracking | Formal financial statements and compliance documentation |
| Format | Interactive charts, graphs, and visual widgets | Structured tables, balance sheets, income statements |
| Data Freshness | Live or frequently updated data | Period-end summarized data (monthly, quarterly, yearly) |
| User Audience | Managers, analysts, and decision-makers | Accountants, auditors, regulators |
| Complexity | Focus on ease of understanding and insights | Detailed and compliant with accounting standards (GAAP, IFRS) |
| Customization | Highly customizable with drill-down options | Standardized formats with limited customization |
| Regulatory Compliance | Not primarily designed for compliance | Essential for legal and tax compliance |
Which is better?
Data visualization dashboards offer real-time insights and interactive analytics that enhance decision-making efficiency in accounting, making complex financial data easier to interpret. Accounting reports provide detailed, structured, and compliant documentation essential for auditing, regulatory requirements, and historical financial analysis. Integrating dashboards with traditional accounting reports optimizes both accuracy and accessibility in financial management.
Connection
Data visualization dashboards transform complex accounting reports into interactive visual formats, enabling quicker identification of financial trends and anomalies. Accounting reports provide the structured data foundation, while dashboards enhance decision-making through real-time insights and customizable metrics. Together, they improve accuracy in financial analysis and streamline reporting processes for accountants and stakeholders.
Key Terms
Financial Statements
Accounting reports provide detailed financial statements such as balance sheets, income statements, and cash flow statements that offer precise and historical financial data crucial for regulatory compliance and auditing. Data visualization dashboards transform these detailed reports into interactive graphs and charts, enabling quicker insight into key financial metrics like revenue trends, expense ratios, and profit margins. Explore how combining detailed accounting reports with dynamic dashboards can enhance financial decision-making.
Key Performance Indicators (KPIs)
Accounting reports provide detailed financial data and comprehensive summaries essential for tracking Key Performance Indicators (KPIs) like revenue, expenses, and profit margins, ensuring accuracy and compliance with accounting standards. Data visualization dashboards transform these KPIs into interactive, real-time visual insights, enabling quicker decision-making through graphs, charts, and trend analysis. Explore how integrating accounting reports with data visualization dashboards can enhance your KPI monitoring and business intelligence.
Real-time Metrics
Accounting reports provide detailed financial summaries focusing on historical data and compliance, while data visualization dashboards emphasize real-time metrics through interactive charts and graphs to monitor ongoing performance. Real-time dashboards enable dynamic decision-making by tracking live financial indicators such as cash flow, expenses, and revenue trends instantly. Explore how integrating both tools can enhance financial oversight and operational agility.
Source and External Links
Accounting Reports: Definition And 3 Types - Accounting reports include the income statement, balance sheet, and cash flow statement, which provide insights into profitability, financial position, and cash flow over a specific period or point in time for a business.
Accounting Reports: Definition, Importance and 3 Types - Accounting reports are financial documents that detail a company's past and present financial situation and are essential for tracking performance, budgeting, tax reporting, and financial decision-making with the main types being income statement, balance sheet, and cash flow statement.
What are Accounting Reports? - Accounting reports show the financial health of a business through statements like balance sheets, profit and loss statements, and cash flow reports, helping management, investors, and creditors make informed decisions.