eBPF (extended Berkeley Packet Filter) enables dynamic tracing and monitoring within the Linux kernel by running sandboxed programs, offering deeper visibility and lower overhead compared to traditional tools. Perf is a powerful performance analyzing tool that collects CPU-bound metrics and tracepoints primarily for profiling applications and kernel functions. Explore further to understand how eBPF surpasses Perf in flexibility and real-time observability.
Why it is important
Understanding the difference between eBPF and Perf is crucial for optimizing Linux performance monitoring and troubleshooting. eBPF provides advanced, programmable kernel-level tracing with minimal overhead, enabling dynamic and flexible observability. Perf is a traditional Linux profiling tool focused on CPU performance data and hardware counters. Leveraging the strengths of both tools enhances debugging accuracy and system analysis efficiency.
Comparison Table
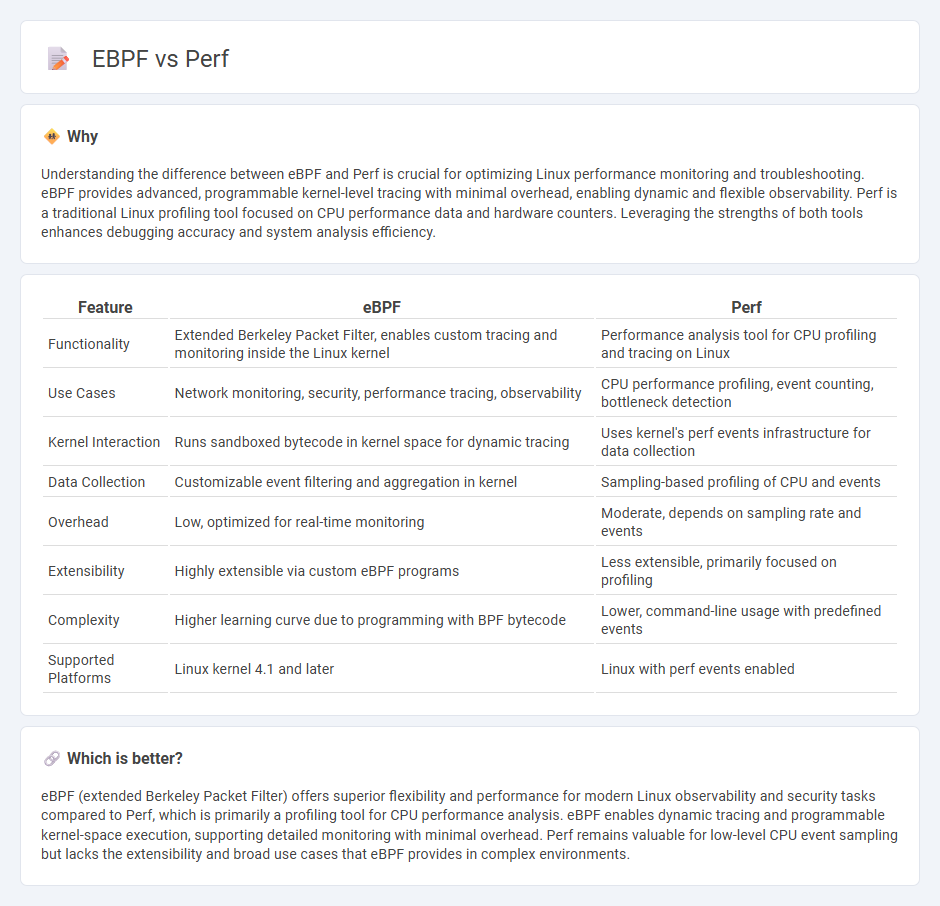
| Feature | eBPF | Perf |
|---|---|---|
| Functionality | Extended Berkeley Packet Filter, enables custom tracing and monitoring inside the Linux kernel | Performance analysis tool for CPU profiling and tracing on Linux |
| Use Cases | Network monitoring, security, performance tracing, observability | CPU performance profiling, event counting, bottleneck detection |
| Kernel Interaction | Runs sandboxed bytecode in kernel space for dynamic tracing | Uses kernel's perf events infrastructure for data collection |
| Data Collection | Customizable event filtering and aggregation in kernel | Sampling-based profiling of CPU and events |
| Overhead | Low, optimized for real-time monitoring | Moderate, depends on sampling rate and events |
| Extensibility | Highly extensible via custom eBPF programs | Less extensible, primarily focused on profiling |
| Complexity | Higher learning curve due to programming with BPF bytecode | Lower, command-line usage with predefined events |
| Supported Platforms | Linux kernel 4.1 and later | Linux with perf events enabled |
Which is better?
eBPF (extended Berkeley Packet Filter) offers superior flexibility and performance for modern Linux observability and security tasks compared to Perf, which is primarily a profiling tool for CPU performance analysis. eBPF enables dynamic tracing and programmable kernel-space execution, supporting detailed monitoring with minimal overhead. Perf remains valuable for low-level CPU event sampling but lacks the extensibility and broad use cases that eBPF provides in complex environments.
Connection
eBPF (extended Berkeley Packet Filter) and Perf are both powerful Linux performance analysis tools that enable dynamic tracing and monitoring of kernel and application behavior. eBPF programs can be attached to Perf events, allowing precise collection of performance metrics and event data with minimal overhead. This integration enhances observability and troubleshooting capabilities by providing detailed insights into system performance and resource utilization.
Key Terms
Kernel tracing
Perf is a powerful Linux profiling tool that leverages kernel tracepoints to gather performance data with minimal overhead, offering real-time insights into CPU usage, system calls, and context switches. eBPF extends tracing capabilities by enabling programmable, efficient, and dynamic probing within the kernel for advanced observability and custom metrics collection. Explore further to understand how eBPF's flexibility enhances kernel tracing beyond traditional perf functionalities.
Dynamic instrumentation
Perf and eBPF are powerful tools for dynamic instrumentation, with perf providing kernel event tracing and performance counters in Linux, while eBPF offers programmable, low-overhead tracing and monitoring capabilities extending beyond traditional perf functionalities. eBPF enables developers to write custom bytecode executed safely in the kernel, allowing dynamic instrumentation of complex events and enriching observability with minimal performance impact. Explore detailed comparisons and use cases to understand how eBPF transforms dynamic instrumentation beyond conventional perf methods.
Observability
eBPF provides advanced observability by enabling dynamic, kernel-level tracing and monitoring without modifying source code, offering deeper insights into system performance compared to perf, which primarily gathers hardware-level performance counters and limited tracepoints. eBPF facilitates fine-grained data collection across user and kernel contexts, supporting complex event filtering and custom metrics ideal for modern cloud-native environments. Discover how leveraging eBPF enhances observability beyond traditional perf tools for comprehensive system analysis.
Source and External Links
Perf Wiki - The Linux Kernel Archives - Perf is a powerful Linux kernel tool for instrumenting CPU performance counters, tracepoints, and dynamic probes, enabling lightweight profiling and detailed performance analysis.
Linux perf Examples - The perf command is a versatile Linux profiler that counts, samples, or runs BPF programs on hardware and software events, with tools like perf stat, perf record, and perf report for different levels of performance analysis.
perf (Linux) - Perf is a performance analyzing tool in Linux, available since kernel 2.6.31, providing subcommands such as stat (event counting), top (hotspot monitoring), record (sampling), and report (profile analysis).