eBPF (extended Berkeley Packet Filter) and Kernel Probes (kprobes) are powerful Linux kernel tracing technologies designed to monitor system performance and debug kernel modules. While kprobes allow dynamic insertion of probes into kernel functions with minimal overhead, eBPF extends this capability by running sandboxed programs in the kernel for advanced data processing and security enforcement. Explore the distinctions and use cases of eBPF versus kprobes to enhance your system observability toolkit.
Why it is important
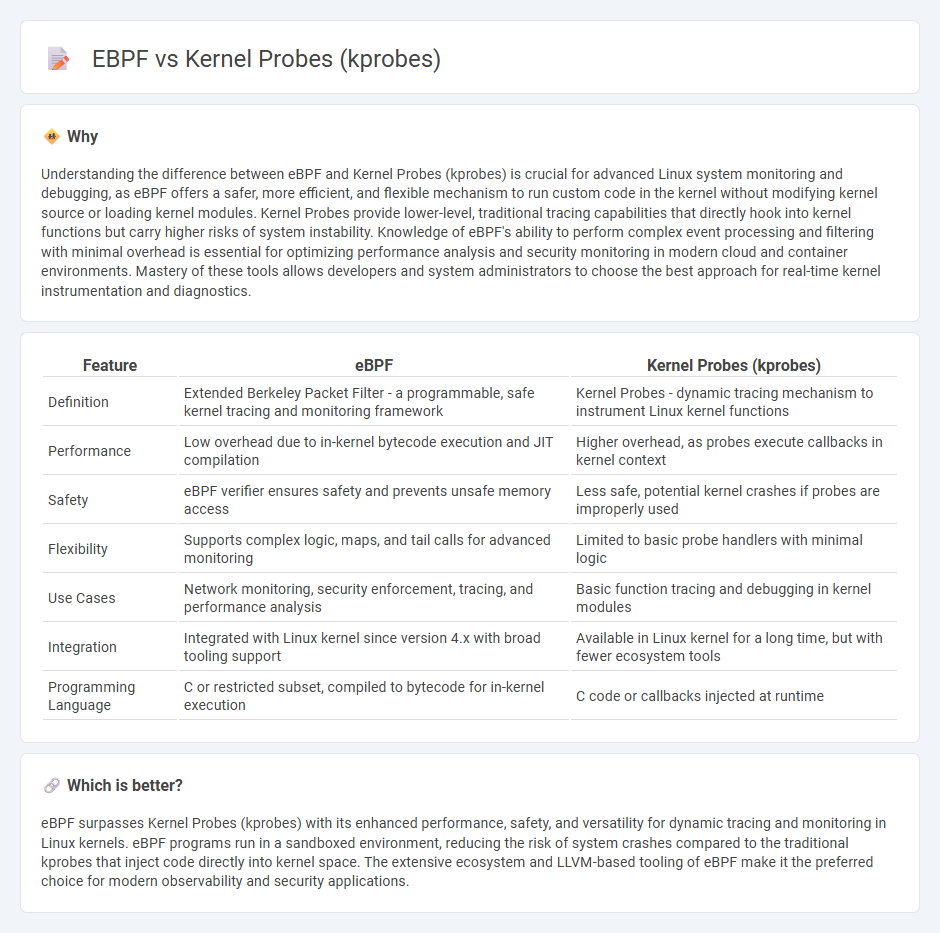
Understanding the difference between eBPF and Kernel Probes (kprobes) is crucial for advanced Linux system monitoring and debugging, as eBPF offers a safer, more efficient, and flexible mechanism to run custom code in the kernel without modifying kernel source or loading kernel modules. Kernel Probes provide lower-level, traditional tracing capabilities that directly hook into kernel functions but carry higher risks of system instability. Knowledge of eBPF's ability to perform complex event processing and filtering with minimal overhead is essential for optimizing performance analysis and security monitoring in modern cloud and container environments. Mastery of these tools allows developers and system administrators to choose the best approach for real-time kernel instrumentation and diagnostics.
Comparison Table
| Feature | eBPF | Kernel Probes (kprobes) |
|---|---|---|
| Definition | Extended Berkeley Packet Filter - a programmable, safe kernel tracing and monitoring framework | Kernel Probes - dynamic tracing mechanism to instrument Linux kernel functions |
| Performance | Low overhead due to in-kernel bytecode execution and JIT compilation | Higher overhead, as probes execute callbacks in kernel context |
| Safety | eBPF verifier ensures safety and prevents unsafe memory access | Less safe, potential kernel crashes if probes are improperly used |
| Flexibility | Supports complex logic, maps, and tail calls for advanced monitoring | Limited to basic probe handlers with minimal logic |
| Use Cases | Network monitoring, security enforcement, tracing, and performance analysis | Basic function tracing and debugging in kernel modules |
| Integration | Integrated with Linux kernel since version 4.x with broad tooling support | Available in Linux kernel for a long time, but with fewer ecosystem tools |
| Programming Language | C or restricted subset, compiled to bytecode for in-kernel execution | C code or callbacks injected at runtime |
Which is better?
eBPF surpasses Kernel Probes (kprobes) with its enhanced performance, safety, and versatility for dynamic tracing and monitoring in Linux kernels. eBPF programs run in a sandboxed environment, reducing the risk of system crashes compared to the traditional kprobes that inject code directly into kernel space. The extensive ecosystem and LLVM-based tooling of eBPF make it the preferred choice for modern observability and security applications.
Connection
eBPF (extended Berkeley Packet Filter) and Kernel Probes (kprobes) are connected through their ability to dynamically trace and monitor kernel-level events without modifying kernel code. kprobes provide instrumentation hooks in the Linux kernel, enabling eBPF programs to attach and collect detailed runtime data for efficient performance analysis and debugging. This integration enhances observability and security by allowing custom monitoring of kernel functions with minimal overhead.
Key Terms
Dynamic Instrumentation
Kernel Probes (kprobes) enable dynamic instrumentation by inserting probes into running kernel code without requiring recompilation, allowing developers to trace events, monitor system behavior, and debug kernel modules. eBPF (extended Berkeley Packet Filter) extends this dynamic tracing capability by providing a safe, flexible virtual machine within the kernel that can execute custom bytecode with minimal overhead and enhanced security features. Explore in-depth comparisons and use cases to understand how kprobes and eBPF transform real-time Linux kernel instrumentation.
Event Tracing
Kernel Probes (kprobes) enable dynamic instrumentation of the Linux kernel by inserting probes at specific kernel functions to capture low-level event traces with minimal overhead. eBPF extends this capability by providing a more flexible, programmable event tracing framework that allows custom scripts to be executed safely inside the kernel, offering enriched context and filtering options. Explore how these tools differ in use cases, performance, and flexibility to optimize Linux event tracing in your environment.
In-Kernel Execution
Kernel Probes (kprobes) enable dynamic tracing by inserting handlers into running kernel code, allowing examination and modification of kernel behavior at specific points without recompiling. eBPF (extended Berkeley Packet Filter) offers a more flexible and efficient in-kernel virtual machine to execute custom programs safely, supporting complex event processing, security monitoring, and networking functions with minimal overhead. Explore detailed comparisons and use cases of kprobes and eBPF to deepen your understanding of in-kernel execution capabilities.
Source and External Links
Kernel Probes - Kprobes provide a lightweight, dynamic mechanism to place automated breakpoints inside running Linux kernel code, allowing kernel modules to register probe handlers for debugging and fault injection without requiring source code changes or recompilation.
System Analysis and Tuning Guide | Kernel probes - Kprobes are one of three types of kernel probes; they insert breakpoints into any kernel instruction, execute a pre-handler, then run the original instruction, followed by a post-handler, enabling fine-grained dynamic debugging of kernel code.
Kernel Probes (Kprobes) - Kprobes dynamically replace the first byte of a kernel instruction with a breakpoint; when triggered, they save CPU registers and run a customizable pre-handler before resuming normal execution, making them suitable for non-disruptive kernel debugging and performance tracing.