eBPF (extended Berkeley Packet Filter) and DTrace are powerful tracing technologies used for system monitoring and debugging in modern operating systems. eBPF allows safe, dynamic code execution inside the Linux kernel, enabling fine-grained observability with minimal performance impact, while DTrace offers comprehensive real-time diagnostics primarily on Solaris and BSD systems. Explore the unique capabilities and use cases of eBPF versus DTrace to optimize your system's performance and troubleshooting approach.
Why it is important
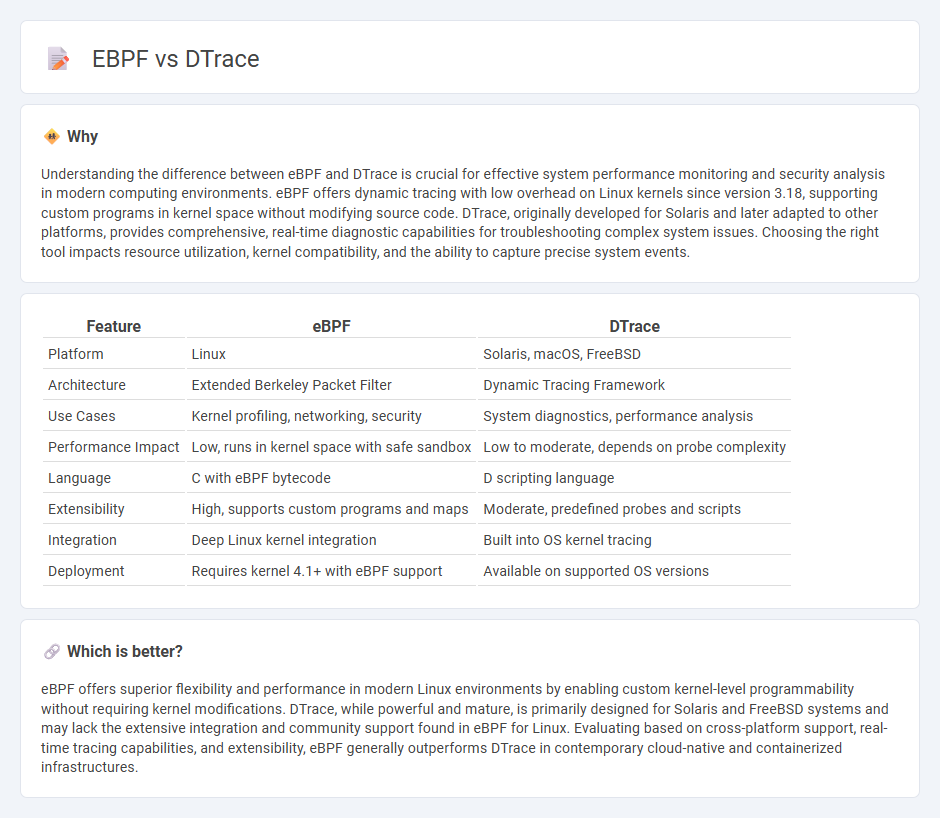
Understanding the difference between eBPF and DTrace is crucial for effective system performance monitoring and security analysis in modern computing environments. eBPF offers dynamic tracing with low overhead on Linux kernels since version 3.18, supporting custom programs in kernel space without modifying source code. DTrace, originally developed for Solaris and later adapted to other platforms, provides comprehensive, real-time diagnostic capabilities for troubleshooting complex system issues. Choosing the right tool impacts resource utilization, kernel compatibility, and the ability to capture precise system events.
Comparison Table
| Feature | eBPF | DTrace |
|---|---|---|
| Platform | Linux | Solaris, macOS, FreeBSD |
| Architecture | Extended Berkeley Packet Filter | Dynamic Tracing Framework |
| Use Cases | Kernel profiling, networking, security | System diagnostics, performance analysis |
| Performance Impact | Low, runs in kernel space with safe sandbox | Low to moderate, depends on probe complexity |
| Language | C with eBPF bytecode | D scripting language |
| Extensibility | High, supports custom programs and maps | Moderate, predefined probes and scripts |
| Integration | Deep Linux kernel integration | Built into OS kernel tracing |
| Deployment | Requires kernel 4.1+ with eBPF support | Available on supported OS versions |
Which is better?
eBPF offers superior flexibility and performance in modern Linux environments by enabling custom kernel-level programmability without requiring kernel modifications. DTrace, while powerful and mature, is primarily designed for Solaris and FreeBSD systems and may lack the extensive integration and community support found in eBPF for Linux. Evaluating based on cross-platform support, real-time tracing capabilities, and extensibility, eBPF generally outperforms DTrace in contemporary cloud-native and containerized infrastructures.
Connection
eBPF and DTrace are connected through their ability to provide advanced observability and tracing capabilities in operating systems, enabling developers to monitor kernel and application behavior in real-time. eBPF extends the concepts pioneered by DTrace by allowing safe, programmable kernel instrumentation on Linux, offering high-performance packet filtering, security monitoring, and system profiling. Both technologies facilitate dynamic tracing without modifying source code or restarting systems, making them essential tools for performance tuning and debugging.
Key Terms
Kernel Instrumentation
DTrace and eBPF serve as powerful kernel instrumentation frameworks with distinct architectures; DTrace excels in Solaris and BSD systems utilizing dynamic tracing scripts, while eBPF offers extensive functionality within the Linux kernel through customizable bytecode programs. eBPF supports a broader range of use cases including networking, security, and performance monitoring with lower overhead and stronger integration into Linux subsystems. Explore in-depth comparisons and practical applications to fully leverage kernel instrumentation benefits.
Dynamic Tracing
DTrace and eBPF are powerful dynamic tracing tools used for real-time system diagnostics and performance analysis, with DTrace primarily available on Solaris and some BSD systems, while eBPF is integrated into the Linux kernel since version 4.1. eBPF offers more flexibility and security by running sandboxed programs within the kernel, enabling deep observability and customization without modifying kernel code. Explore detailed comparisons and use cases to understand which dynamic tracing solution best fits your system monitoring needs.
Observability
DTrace and eBPF are powerful observability tools that provide deep insights into system performance and behavior through dynamic tracing. DTrace excels in Solaris and BSD systems with its comprehensive scripting language and stability, while eBPF offers modern, flexible tracing capabilities integrated into the Linux kernel, enabling low-overhead monitoring and advanced filtering. Explore the detailed comparisons of DTrace and eBPF to understand which observability solution best fits your infrastructure needs.
Source and External Links
DTrace on Windows - Windows drivers | Microsoft Learn - DTrace is an open-source dynamic tracing platform originally developed for Solaris, now ported to Windows providing system and event tracing through the D language and extended with Windows-specific features like ETW instrumentation and live dump capture.
About DTrace - DTrace is a performance analysis and troubleshooting tool included in Solaris, Mac OS X, FreeBSD, and ported to Linux, dynamically instrumenting user and kernel software with a C-like scripting language to minimize overhead in production systems.
DTrace - Wikipedia - DTrace is a comprehensive dynamic tracing framework by Sun Microsystems that uses probes and the D programming language to safely instrument and analyze live running kernel and application code minimizing performance impact for production use.