eBPF enables efficient, programmable kernel-level tracing by executing custom bytecode safely, offering deeper visibility and lower overhead compared to traditional tools. Strace intercepts and records system calls from user-space processes, providing detailed debugging information but with performance limitations. Explore the capabilities of eBPF and strace to determine the best fit for your system monitoring needs.
Why it is important
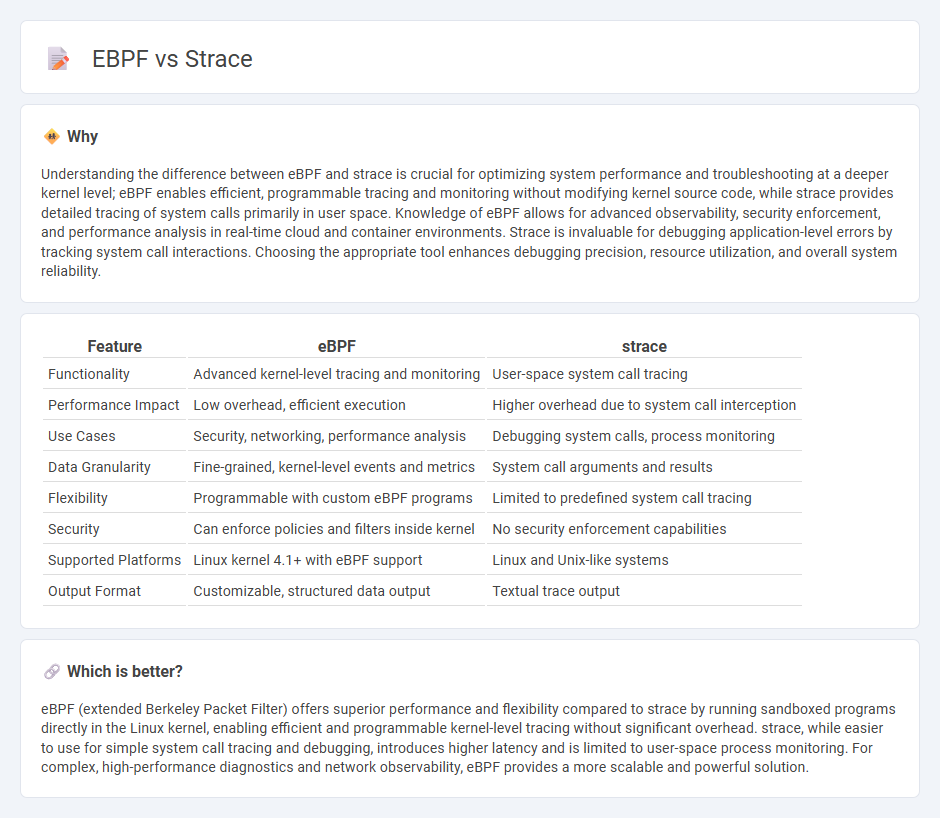
Understanding the difference between eBPF and strace is crucial for optimizing system performance and troubleshooting at a deeper kernel level; eBPF enables efficient, programmable tracing and monitoring without modifying kernel source code, while strace provides detailed tracing of system calls primarily in user space. Knowledge of eBPF allows for advanced observability, security enforcement, and performance analysis in real-time cloud and container environments. Strace is invaluable for debugging application-level errors by tracking system call interactions. Choosing the appropriate tool enhances debugging precision, resource utilization, and overall system reliability.
Comparison Table
| Feature | eBPF | strace |
|---|---|---|
| Functionality | Advanced kernel-level tracing and monitoring | User-space system call tracing |
| Performance Impact | Low overhead, efficient execution | Higher overhead due to system call interception |
| Use Cases | Security, networking, performance analysis | Debugging system calls, process monitoring |
| Data Granularity | Fine-grained, kernel-level events and metrics | System call arguments and results |
| Flexibility | Programmable with custom eBPF programs | Limited to predefined system call tracing |
| Security | Can enforce policies and filters inside kernel | No security enforcement capabilities |
| Supported Platforms | Linux kernel 4.1+ with eBPF support | Linux and Unix-like systems |
| Output Format | Customizable, structured data output | Textual trace output |
Which is better?
eBPF (extended Berkeley Packet Filter) offers superior performance and flexibility compared to strace by running sandboxed programs directly in the Linux kernel, enabling efficient and programmable kernel-level tracing without significant overhead. strace, while easier to use for simple system call tracing and debugging, introduces higher latency and is limited to user-space process monitoring. For complex, high-performance diagnostics and network observability, eBPF provides a more scalable and powerful solution.
Connection
eBPF and strace intersect in system call tracing and kernel-level observability, enabling detailed monitoring and debugging of application behavior. eBPF extends strace functionality by executing custom programs safely within the Linux kernel, providing high-performance, programmable tracing without modifying application code. This combination empowers developers to gain deep insights into system interactions, optimize performance, and enhance security through dynamic analysis.
Key Terms
System Call Tracing
Strace directly intercepts and records system calls made by a process, providing detailed insights into program execution with minimal setup. eBPF enhances system call tracing by enabling dynamic, in-kernel monitoring with lower overhead and greater flexibility for complex event filtering and aggregation. Discover how these tools transform system call analysis and choose the best fit for your performance and debugging needs.
Kernel Instrumentation
strace provides detailed syscall tracing by intercepting user-level system calls, offering insights primarily at the user-kernel boundary. eBPF enhances kernel instrumentation with dynamic, programmable tracing capabilities that operate inside the kernel, enabling more granular performance monitoring and security enforcement with minimal overhead. Explore further to understand how eBPF's flexibility outperforms traditional tracing tools like strace in modern Linux environments.
Observability
Strace provides system call tracing by intercepting and logging system calls made by a process, offering granular insights but with considerable performance overhead. In contrast, eBPF (extended Berkeley Packet Filter) enables dynamic, high-performance observability by running sandboxed programs in the kernel, allowing extensive monitoring of kernel and user-space events with minimal latency. Explore the distinctions between strace and eBPF to enhance your observability toolkit and optimize system diagnostics.
Source and External Links
strace - Wikipedia - strace is a Linux userspace utility for monitoring and tampering with the interactions between processes and the kernel, such as system calls, signals, and state changes.
strace - strace is a diagnostic tool for Linux that allows users to trace and alter how processes interact with the system kernel, including system calls and signals, without requiring program recompilation.
strace(1) - Linux manual page - strace runs a specified command and intercepts and records all system calls and signals it makes, outputting details such as call names, arguments, and return values, which is valuable for debugging and system diagnostics.