Retail shrinkage analytics focuses on identifying and reducing inventory loss caused by theft, damage, or administrative errors, leveraging data to enhance security measures and profit margins. Store traffic analysis examines customer flow patterns and dwell times to optimize store layouts, staffing, and marketing strategies for increased sales performance. Explore the differences and benefits of both approaches to improve retail operations and profitability.
Why it is important
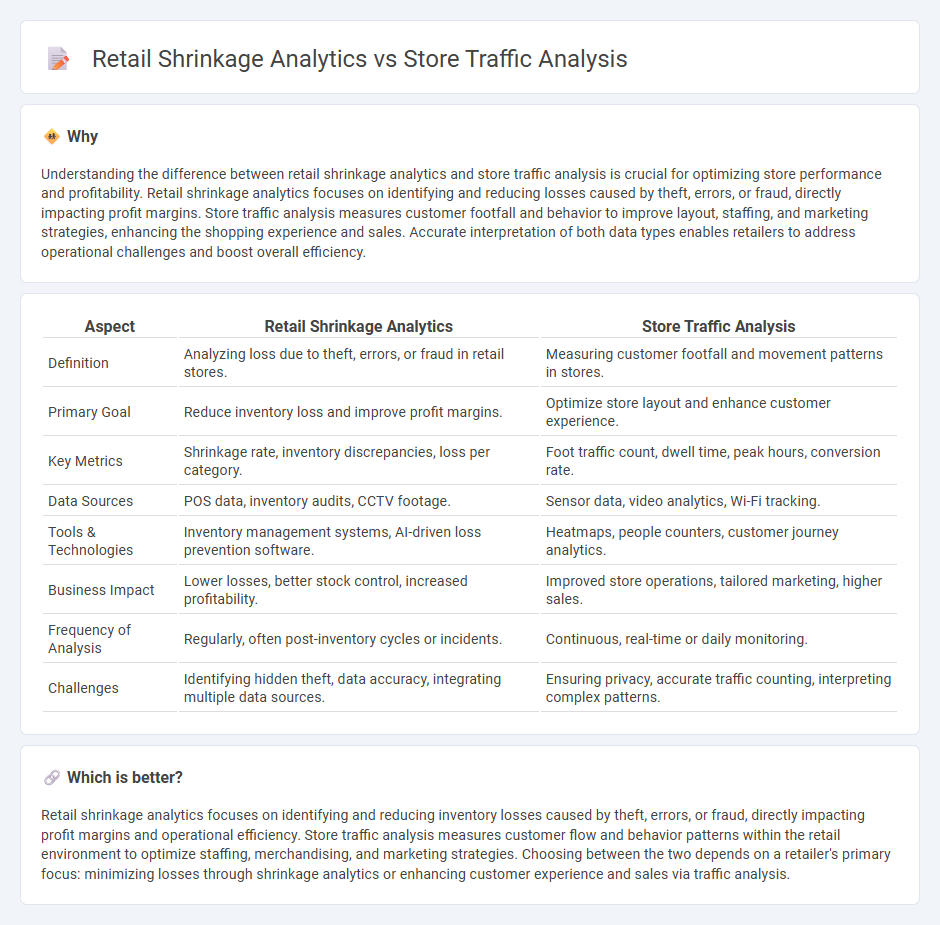
Understanding the difference between retail shrinkage analytics and store traffic analysis is crucial for optimizing store performance and profitability. Retail shrinkage analytics focuses on identifying and reducing losses caused by theft, errors, or fraud, directly impacting profit margins. Store traffic analysis measures customer footfall and behavior to improve layout, staffing, and marketing strategies, enhancing the shopping experience and sales. Accurate interpretation of both data types enables retailers to address operational challenges and boost overall efficiency.
Comparison Table
| Aspect | Retail Shrinkage Analytics | Store Traffic Analysis |
|---|---|---|
| Definition | Analyzing loss due to theft, errors, or fraud in retail stores. | Measuring customer footfall and movement patterns in stores. |
| Primary Goal | Reduce inventory loss and improve profit margins. | Optimize store layout and enhance customer experience. |
| Key Metrics | Shrinkage rate, inventory discrepancies, loss per category. | Foot traffic count, dwell time, peak hours, conversion rate. |
| Data Sources | POS data, inventory audits, CCTV footage. | Sensor data, video analytics, Wi-Fi tracking. |
| Tools & Technologies | Inventory management systems, AI-driven loss prevention software. | Heatmaps, people counters, customer journey analytics. |
| Business Impact | Lower losses, better stock control, increased profitability. | Improved store operations, tailored marketing, higher sales. |
| Frequency of Analysis | Regularly, often post-inventory cycles or incidents. | Continuous, real-time or daily monitoring. |
| Challenges | Identifying hidden theft, data accuracy, integrating multiple data sources. | Ensuring privacy, accurate traffic counting, interpreting complex patterns. |
Which is better?
Retail shrinkage analytics focuses on identifying and reducing inventory losses caused by theft, errors, or fraud, directly impacting profit margins and operational efficiency. Store traffic analysis measures customer flow and behavior patterns within the retail environment to optimize staffing, merchandising, and marketing strategies. Choosing between the two depends on a retailer's primary focus: minimizing losses through shrinkage analytics or enhancing customer experience and sales via traffic analysis.
Connection
Retail shrinkage analytics leverages store traffic analysis to identify patterns of customer movement that correlate with inventory loss or theft. By integrating data from foot traffic sensors and point-of-sale systems, retailers can detect unusual behaviors during peak or low traffic periods that signal potential shrinkage. This data-driven approach optimizes loss prevention strategies and enhances store layout efficiency to reduce shrinkage rates.
Key Terms
**Store Traffic Analysis:**
Store traffic analysis involves measuring and interpreting customer footfall patterns to optimize store layout and improve sales performance. Key metrics include visitor count, peak shopping times, and conversion rates, which help retailers enhance customer experience and operational efficiency. Explore more to understand how advanced traffic analytics drive strategic retail decisions.
Footfall counters
Store traffic analysis using footfall counters measures the number of customers entering a retail location, providing critical data on peak shopping times and customer behavior patterns. Retail shrinkage analytics, on the other hand, focuses on identifying and reducing losses due to theft, fraud, or inventory errors by analyzing discrepancies between recorded sales and actual inventory. Explore how integrating footfall counter data with shrinkage analytics can enhance loss prevention strategies and maximize retail profitability.
Conversion rate
Store traffic analysis tracks customer footfall patterns to evaluate engagement zones and peak visit times, directly influencing store layout and staffing strategies. Retail shrinkage analytics quantifies inventory loss and identifies sources of theft or errors, indirectly affecting availability and sales potential. Explore how optimizing conversion rates through integrated traffic and shrinkage insights can enhance overall retail performance.
Source and External Links
Retail Foot Traffic Data: Use Cases & How to Collect (2025) - Shopify - Store traffic analysis involves collecting data on visitor volume, dwell time, conversion rate, average basket size, return visits, and inventory turnover to understand customer behavior and improve store efficiency using technology like sensors and data unification platforms.
Foot Traffic and Conversion Rate Analysis - Umbrex - Store traffic analysis assesses how effectively visitors are converted into purchasers by collecting visitor and transaction counts, calculating conversion rates, segmenting by demographics, tracking trends over time, and correlating traffic with sales revenue.
Retail Foot Traffic Analysis: A Comprehensive Guide | AlphaMap - Analyzing store traffic includes gathering visitor frequency and demographics data to identify shopping patterns, optimize marketing, improve customer retention, and adjust store layouts for better performance.