Cost-to-serve analysis quantifies the total expenses incurred to deliver a product or service to customers, focusing on profitability by identifying high-cost segments. Process mapping visually outlines operational workflows to pinpoint inefficiencies and streamline activities, enhancing overall process performance. Explore the key differences and applications of both methods to optimize business consulting strategies.
Why it is important
Understanding the difference between cost-to-serve analysis and process mapping is crucial in consulting because cost-to-serve quantifies the total expense of delivering a product or service to a customer, while process mapping visualizes the workflow steps for operational efficiency. Cost-to-serve analysis helps identify profitability by allocating direct and indirect costs to specific customers or products, enabling targeted cost reduction strategies. Process mapping facilitates identifying bottlenecks and inefficiencies in business processes, supporting process improvements and enhanced performance. Knowing both tools enables consultants to optimize financial outcomes alongside operational effectiveness.
Comparison Table
| Aspect | Cost-to-Serve Analysis | Process Mapping |
|---|---|---|
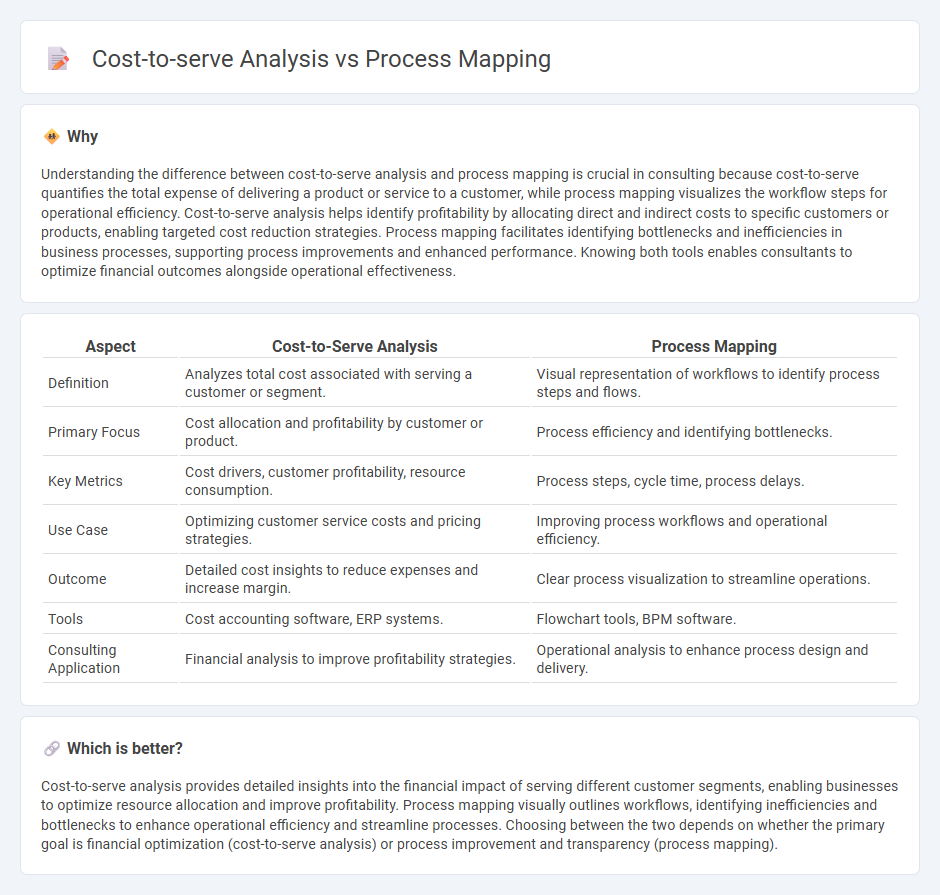
| Definition | Analyzes total cost associated with serving a customer or segment. | Visual representation of workflows to identify process steps and flows. |
| Primary Focus | Cost allocation and profitability by customer or product. | Process efficiency and identifying bottlenecks. |
| Key Metrics | Cost drivers, customer profitability, resource consumption. | Process steps, cycle time, process delays. |
| Use Case | Optimizing customer service costs and pricing strategies. | Improving process workflows and operational efficiency. |
| Outcome | Detailed cost insights to reduce expenses and increase margin. | Clear process visualization to streamline operations. |
| Tools | Cost accounting software, ERP systems. | Flowchart tools, BPM software. |
| Consulting Application | Financial analysis to improve profitability strategies. | Operational analysis to enhance process design and delivery. |
Which is better?
Cost-to-serve analysis provides detailed insights into the financial impact of serving different customer segments, enabling businesses to optimize resource allocation and improve profitability. Process mapping visually outlines workflows, identifying inefficiencies and bottlenecks to enhance operational efficiency and streamline processes. Choosing between the two depends on whether the primary goal is financial optimization (cost-to-serve analysis) or process improvement and transparency (process mapping).
Connection
Cost-to-serve analysis quantifies the total expenses involved in delivering products or services to customers, identifying high-cost activities. Process mapping visually represents each step in the service delivery chain, highlighting inefficiencies and bottlenecks. Integrating process mapping with cost-to-serve analysis enables companies to pinpoint specific processes driving costs and implement targeted improvements to enhance profitability.
Key Terms
Value Stream
Process mapping visually outlines each step in a value stream to identify inefficiencies and optimize workflow for improved operational efficiency. Cost-to-serve analysis quantifies the total expenses associated with delivering a product or service along the value stream, highlighting cost drivers and areas for margin enhancement. Explore deeper insights into how integrating process mapping with cost-to-serve analysis can enhance value stream management.
Activity-Based Costing
Process mapping visually outlines each step within a business operation, identifying inefficiencies and opportunities for improvement, while cost-to-serve analysis calculates the total expenses incurred to deliver a product or service to a customer, emphasizing profitability. Activity-Based Costing (ABC) integrates these approaches by assigning overhead and indirect costs to specific activities based on their actual consumption, enabling precise cost allocation and clearer insights into cost drivers. Explore how combining process mapping with ABC-driven cost-to-serve analysis can enhance strategic decision-making and operational efficiency.
Workflow Optimization
Process mapping visualizes each step in a workflow to identify inefficiencies, redundancies, and bottlenecks that hinder productivity, providing a clear path for workflow optimization. Cost-to-serve analysis calculates the total cost incurred to deliver products or services to customers, highlighting which processes consume the most resources, directly influencing cost-saving strategies. Explore how integrating process mapping with cost-to-serve analysis can transform your operational efficiency and reduce overall expenses.
Source and External Links
What is Process Mapping? | IBM - Process mapping visually represents workflows to better understand processes, identify task owners, timelines, and areas for improvement using standardized symbols from BPMN or UML for clearer communication and efficiency improvement.
Process Mapping: Tools and Techniques - Process mapping defines what a business does, who is responsible, and the criteria for success by identifying start and end points, task breakdowns, decisions, and participants, using graphic symbols to display process flow clearly.
What is Process Mapping? [+How to Create One] - Process mapping helps teams visualize workflows, coordinate inputs and decision points, and improve productivity by determining process boundaries, interviewing stakeholders, and refining the map to eliminate roadblocks.