Ecosystem mapping reveals the complex network of stakeholders, partners, and market dynamics influencing sales performance, providing a broader perspective than traditional organizational chart analysis. Organizational charts focus on internal structure and reporting lines, highlighting roles, responsibilities, and hierarchies essential for managing sales teams and processes. Explore how integrating ecosystem mapping with organizational chart analysis can drive strategic sales growth and operational efficiency.
Why it is important
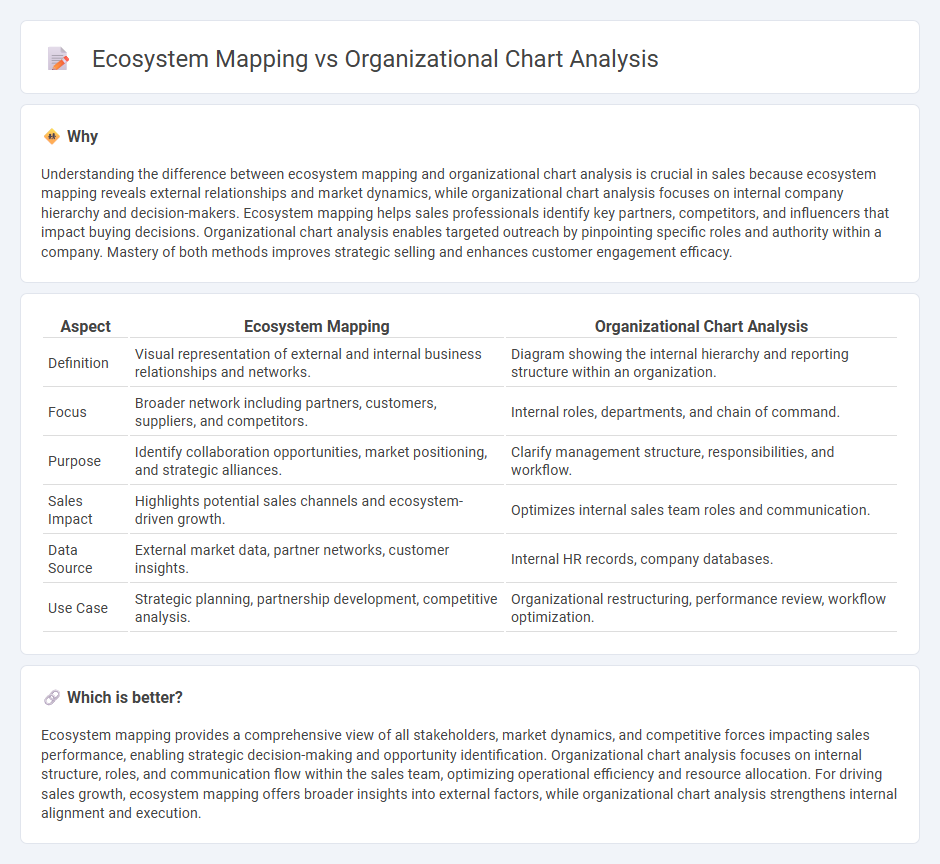
Understanding the difference between ecosystem mapping and organizational chart analysis is crucial in sales because ecosystem mapping reveals external relationships and market dynamics, while organizational chart analysis focuses on internal company hierarchy and decision-makers. Ecosystem mapping helps sales professionals identify key partners, competitors, and influencers that impact buying decisions. Organizational chart analysis enables targeted outreach by pinpointing specific roles and authority within a company. Mastery of both methods improves strategic selling and enhances customer engagement efficacy.
Comparison Table
| Aspect | Ecosystem Mapping | Organizational Chart Analysis |
|---|---|---|
| Definition | Visual representation of external and internal business relationships and networks. | Diagram showing the internal hierarchy and reporting structure within an organization. |
| Focus | Broader network including partners, customers, suppliers, and competitors. | Internal roles, departments, and chain of command. |
| Purpose | Identify collaboration opportunities, market positioning, and strategic alliances. | Clarify management structure, responsibilities, and workflow. |
| Sales Impact | Highlights potential sales channels and ecosystem-driven growth. | Optimizes internal sales team roles and communication. |
| Data Source | External market data, partner networks, customer insights. | Internal HR records, company databases. |
| Use Case | Strategic planning, partnership development, competitive analysis. | Organizational restructuring, performance review, workflow optimization. |
Which is better?
Ecosystem mapping provides a comprehensive view of all stakeholders, market dynamics, and competitive forces impacting sales performance, enabling strategic decision-making and opportunity identification. Organizational chart analysis focuses on internal structure, roles, and communication flow within the sales team, optimizing operational efficiency and resource allocation. For driving sales growth, ecosystem mapping offers broader insights into external factors, while organizational chart analysis strengthens internal alignment and execution.
Connection
Ecosystem mapping identifies key players, relationships, and market dynamics essential for optimizing sales strategies, while organizational chart analysis reveals decision-makers and communication flows within target companies. Combining these tools enhances targeting precision by aligning external ecosystem insights with internal organizational structures. This integrated approach drives more effective sales engagement and accelerates deal closure.
Key Terms
**Organizational Chart Analysis:**
Organizational Chart Analysis provides a structured visualization of a company's hierarchy, roles, and reporting lines, enabling clear identification of decision-making authority and communication flow within departments. This focused examination highlights internal relationships and workflow efficiency, offering insights into resource allocation and potential management bottlenecks. Explore how Organizational Chart Analysis can optimize your business structure and enhance operational clarity.
Reporting Structure
Organizational chart analysis provides a clear visualization of reporting structures, delineating hierarchical relationships and formal authority within a company. Ecosystem mapping, in contrast, captures broader network interactions and influence flows beyond direct reporting lines, emphasizing collaboration and external partnerships. Explore how understanding both methods enhances strategic decision-making in complex business environments.
Decision Makers
Organizational chart analysis identifies key decision makers within a company's hierarchical structure, clarifying roles, authority levels, and reporting lines essential for targeted communication and influence. Ecosystem mapping extends this insight by situating decision makers within broader networks of partners, competitors, and stakeholders, revealing external influences and collaboration opportunities. Explore how combining both methods enhances strategic engagement and informed decision-making.
Source and External Links
Organizational Chart Best Practices - This guide provides best practices for creating meaningful organizational charts, highlighting their importance in clarity, communication, decision-making, resource allocation, and change management.
What Is an Organizational Chart? - This article explains how organizational charts are used to boost efficiency by mapping company hierarchies and roles, aiding in decision-making and operational efficiency.
Organizational Charts Explained: a Beginner's Guide - This guide provides a step-by-step process for creating organizational charts, including determining structure, identifying roles, and choosing the right chart type for the company's needs.