Ethnographic listening captures authentic customer behaviors and emotions through in-depth observation and interviews, while heat mapping visually analyzes user interactions on digital platforms to identify attention hotspots. Both methods provide valuable insights for optimizing marketing strategies and enhancing user experience. Explore how combining ethnographic listening with heat mapping can transform your marketing efforts.
Why it is important
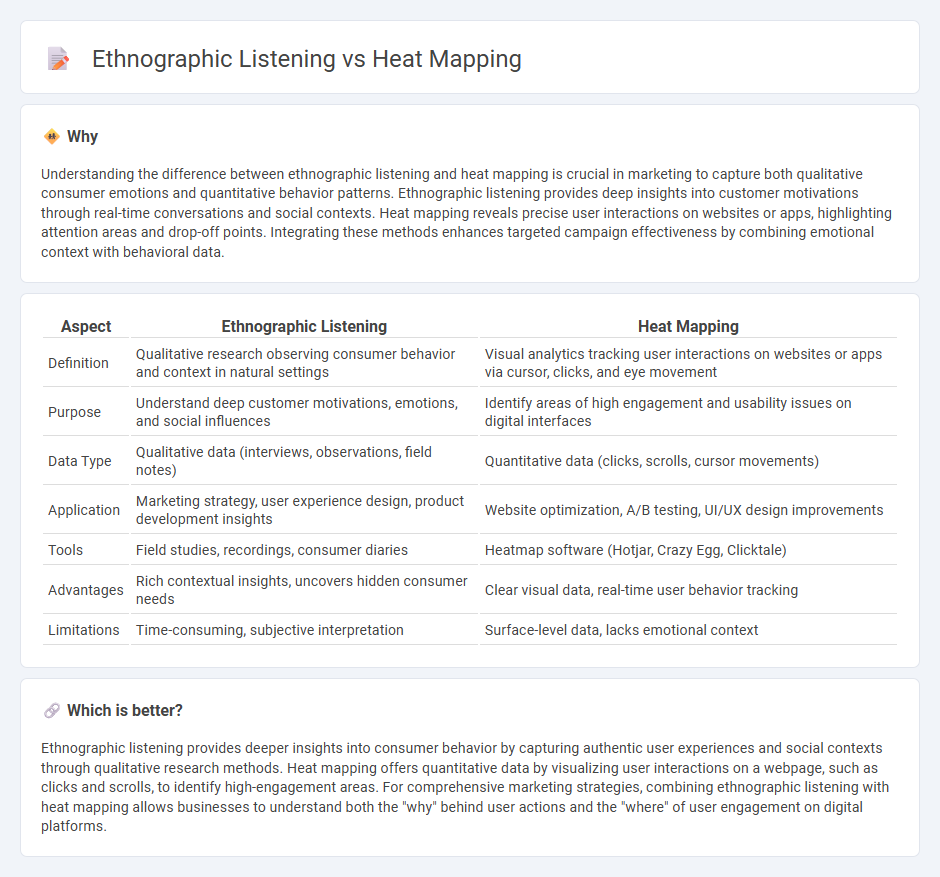
Understanding the difference between ethnographic listening and heat mapping is crucial in marketing to capture both qualitative consumer emotions and quantitative behavior patterns. Ethnographic listening provides deep insights into customer motivations through real-time conversations and social contexts. Heat mapping reveals precise user interactions on websites or apps, highlighting attention areas and drop-off points. Integrating these methods enhances targeted campaign effectiveness by combining emotional context with behavioral data.
Comparison Table
| Aspect | Ethnographic Listening | Heat Mapping |
|---|---|---|
| Definition | Qualitative research observing consumer behavior and context in natural settings | Visual analytics tracking user interactions on websites or apps via cursor, clicks, and eye movement |
| Purpose | Understand deep customer motivations, emotions, and social influences | Identify areas of high engagement and usability issues on digital interfaces |
| Data Type | Qualitative data (interviews, observations, field notes) | Quantitative data (clicks, scrolls, cursor movements) |
| Application | Marketing strategy, user experience design, product development insights | Website optimization, A/B testing, UI/UX design improvements |
| Tools | Field studies, recordings, consumer diaries | Heatmap software (Hotjar, Crazy Egg, Clicktale) |
| Advantages | Rich contextual insights, uncovers hidden consumer needs | Clear visual data, real-time user behavior tracking |
| Limitations | Time-consuming, subjective interpretation | Surface-level data, lacks emotional context |
Which is better?
Ethnographic listening provides deeper insights into consumer behavior by capturing authentic user experiences and social contexts through qualitative research methods. Heat mapping offers quantitative data by visualizing user interactions on a webpage, such as clicks and scrolls, to identify high-engagement areas. For comprehensive marketing strategies, combining ethnographic listening with heat mapping allows businesses to understand both the "why" behind user actions and the "where" of user engagement on digital platforms.
Connection
Ethnographic listening analyzes consumer behavior by capturing authentic user experiences and cultural contexts, while heat mapping visually represents user interaction patterns on digital platforms. Together, these methods provide comprehensive insights into customer preferences and decision-making processes, enhancing targeted marketing strategies. Integrating ethnographic data with heat map analytics helps marketers optimize user engagement and improve conversion rates.
Key Terms
User Behavior
Heat mapping provides visual data on user interactions by tracking mouse movements, clicks, and scroll patterns, revealing which parts of a webpage attract the most attention. Ethnographic listening involves observing and analyzing users' verbal and non-verbal feedback in real-life contexts to understand motivations and emotional responses behind their behavior. Explore deeper insights into user behavior by comparing these methods to enhance UX strategy and design effectiveness.
Qualitative Insights
Heat mapping visually captures user interaction patterns on websites, revealing areas of high engagement and potential usability issues through click, scroll, and hover data. Ethnographic listening involves immersive observation and in-depth interviews, providing rich qualitative insights into user behaviors, motivations, and emotional responses beyond surface metrics. Explore how combining these methods enhances understanding of user experience for comprehensive qualitative analysis.
Data Visualization
Heat mapping uses color-coded visual representations to highlight user engagement on digital interfaces, providing immediate insights into click patterns, scrolling behavior, and attention hotspots. Ethnographic listening involves qualitative data collection and analysis to understand user emotions, motivations, and cultural contexts behind their interactions, offering deeper behavioral insights beyond surface metrics. Explore how combining heat mapping with ethnographic listening can enhance your data visualization strategies for more comprehensive user experience analysis.
Source and External Links
Heat map - Wikipedia - A heat map is a 2D data visualization that uses color to represent the magnitude of individual values in a dataset, and includes types like spatial (over maps) and grid (matrix) heat maps.
What is a heat map (heatmap)? | Definition from TechTarget - A heat map visually summarizes information across two axes using color gradients, allowing quick identification of high and low values or patterns in the data.
Heatmapper - Heatmapper is a free web tool that lets users create, customize, and explore various types of heat maps for diverse data types and applications.
 dowidth.com